
Litecoin Price Analysis LTC/USD: Downfall
LTC / USD Technical Analysis: Litecoin is bearish on all timeframes. Reaching down to $40 would have disastrous consequences.
- Litecoin has a bearish short-term and medium-term trading bias
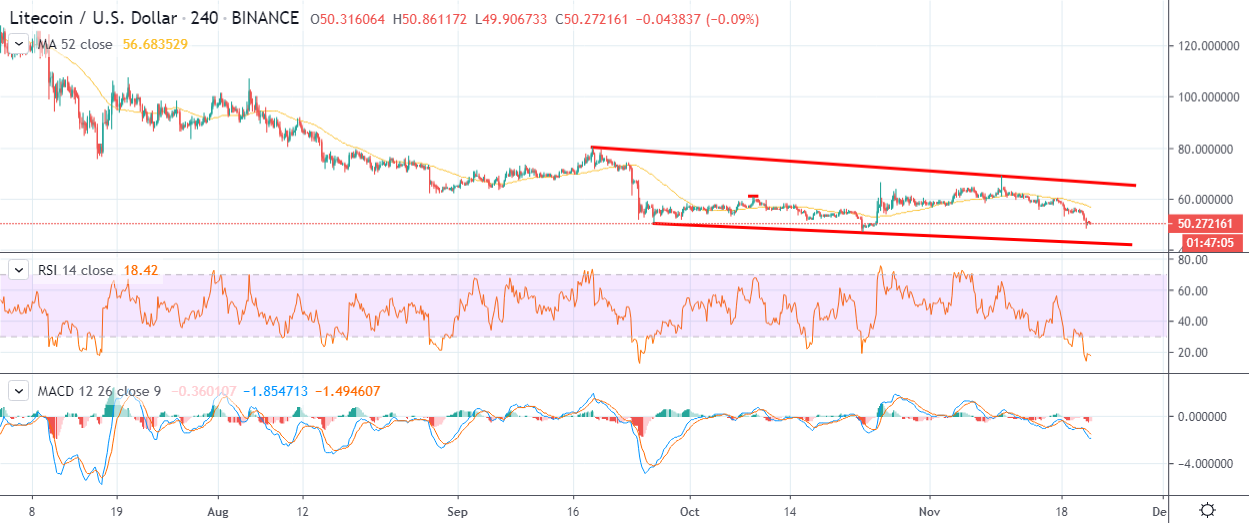
- The four-hour time frame shows that the LTC/USD pair is trading in a descending price channel
- A sustained loss of the $47.00 level would be extremely bearish for Litecoin
Litecoin has erased its early month trading gains, leaving the cryptocurrency testing back towards the October monthly trading low, just below the $50.00 level.
The LTC/USD pair now trades down by over 25% from its monthly peak, and nearly 70% lower than its 2019 trading high around $160.
The strong bid-tone that was present during the summer months never fully returned to the LTC/USD pair, with recent price action suggesting that buying demand was waning above the $60.00 level.
The technicals for Litecoin are clearly showing that a loss of the $47.00 level could cause a quick drop towards the $40.00 level. In fact, this level has particular importance on both the four-hour and daily time frames.
The four-hour time frame shows that Litecoin is trading within a descending price channel, with the $40.00 level the bottom of the price channel. A break under the October monthly level would confirm an upcoming technical test of the $40.00 level.
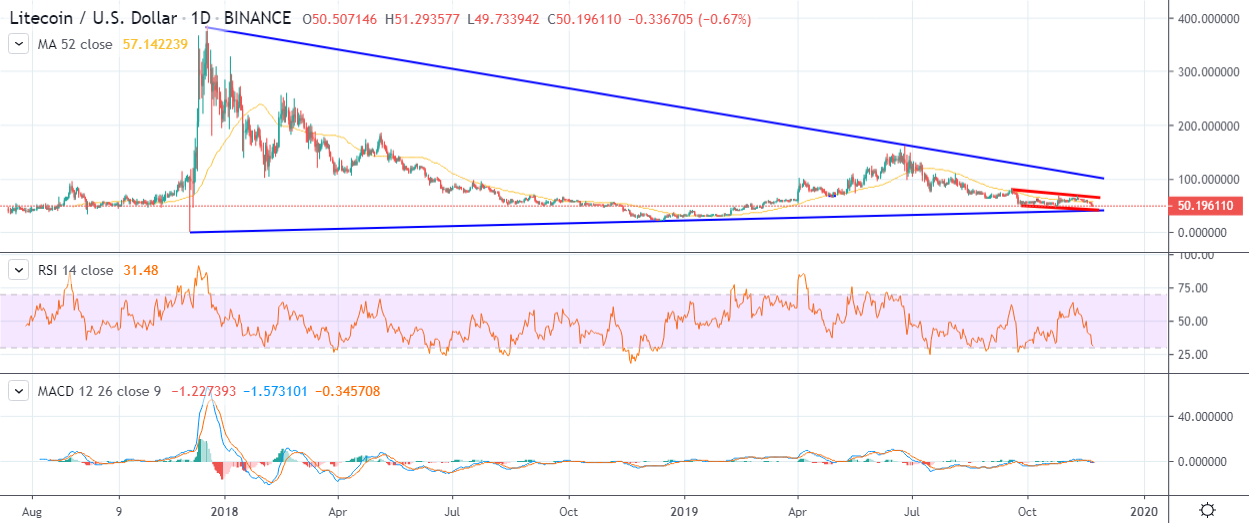
Looking at the daily time frame, a large wedge pattern has formed, which hints that a major technical breakout could be on the horizon over the medium-term.
Interestingly, the bottom of the large wedge pattern is located at the $40.00 level, making it an important technical area that LTC/USD buyers must defend to avoid capitulation towards the $25.00 level.
Overall, traders have few reasons to be bullish towards the LTC/USD pair at present, especially if the October trading low around $47 is broken.
According to the latest sentiment data from TheTIE.io, the short-term sentiment towards Litecoin is bearish, at 32.50 %, while the overall long-term sentiment towards the cryptocurrency is neutral, at 54.00%.
Upside Potential
The four-hour time frame shows that key technical resistance is located at the $57.00 and $60.00 levels. Buyers ideally need to rally price above the $69.00 level to start creating bullish higher highs.
Key technical resistance above the current monthly trading high is found at the $80.00 and $90.00 levels.
Downside Potential
The four-hour time frame is showing that the LTC/USD pair has medium-term technical support around the $47.00 and $45.00 levels.
Critical long-term technical support for the LTC/USD pair is located at the $40.00 and $25.00 levels.
Summary
Traders have few reasons to be bullish towards the LTC/USD pair now, with the cryptocurrency technically bearish on all fronts.
Overall, the LTC/USD pair must bounce from the $40.00 level or face capitulation towards the $25.00 area.
Check out our coin guide for an introduction to Litecoin.
We also wrote a DARE (Digital Asset Report and Evaluation) for the project, analyzing the future prospects of the Bitcoin competitor.