
Litecoin Price Analysis LTC / USD: Dog Tired After A Long Night
LTC is under increasing selling pressure.
- Litecoin remains heavily bearish over the short-term and the medium-term
- The four-hour time and the daily time frame both show bearish head and shoulders patterns
- The $36.00 level could be an are bargain hunters may be looking to enter LTC / USD long positions.
After celebrating its eighth birthday, Litecoin is back under heavy downside pressure towards the $50.00 level, after the fifth-largest cryptocurrency failed to gain momentum above the $60.00 level earlier this month.
Both short and medium-term technical analysis shows that a breakout under the $50.00 level would be extremely bearish for the LTC / USD pair. The cryptocurrency could be at risk of eroding around twenty percent of its value if a sustained breakout under the $50.00 level does occur.
The recent price action surrounding the LTC / USD pair has been extremely weak. Other cryptocurrencies have been able to stage strong early month rallies, while Litecoin has rarely strayed from its monthly opening price.
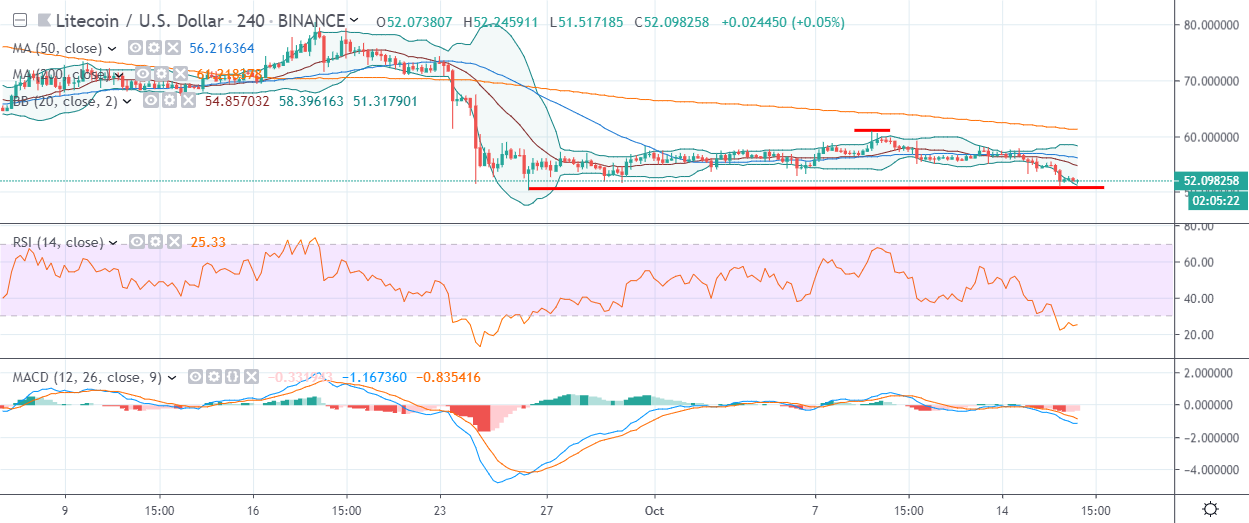
Looking at the four-hour time frame, a bearish head and shoulders pattern is currently in play, with the pattern showing a $10.00 downside projection, which would take the LTC / USD pair towards the $40.00 level.
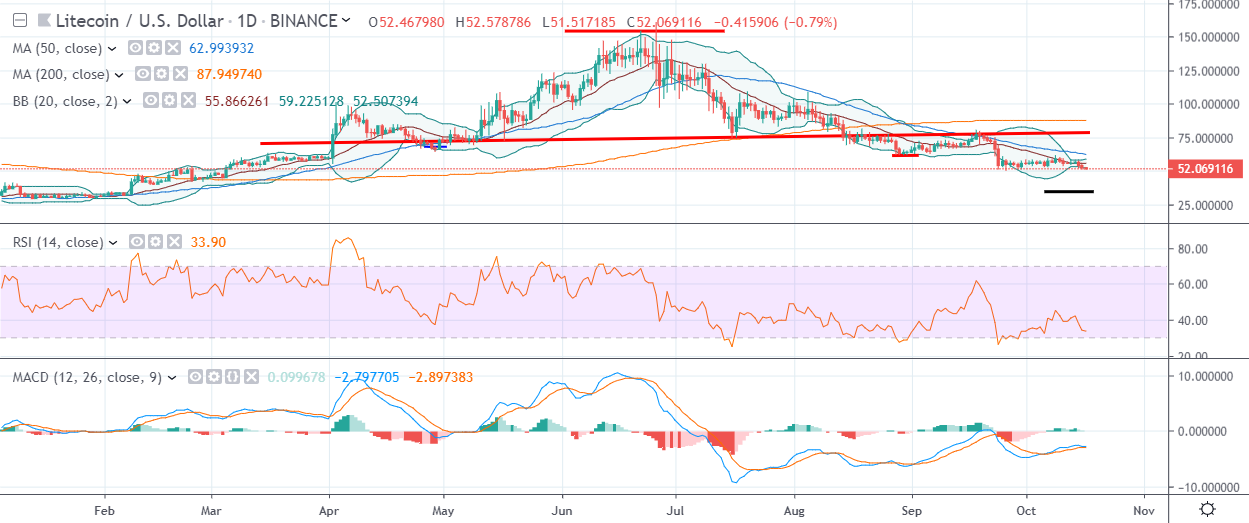
The daily time frame also shows a bearish head and shoulders pattern, with the $36.00 level a possible bearish target if bulls fail to move price away from the $50.00 level.
The LTC / USD pair is also starting to breakout from the lower Bollinger bands on the four-hour and daily time frames. The weekly time frame shows the next Bollinger band support area comes in at around $35.00.
It is worth considering that the LTC / USD pair is approaching oversold conditions according to medium-term technical indicator. A drop of around twenty percent may encourage dip-buyers to enter in the LTC / USD pair from depressed levels.
According to the latest sentiment data from TheTIE.io, the short-term sentiment towards Litecoin is neutral, at 46.00 %, while the overall long-term sentiment towards the cryptocurrency is extremely bearish, at 26.00%.
Upside Potential
The four-hour time frame highlights that bulls need to move price above the $60.00 level to relieve short-term selling pressure. Once above the $60.00 level, the LTC / USD pair has limited technical resistance until the $66.00 level.
The daily time frame shows that a bearish death-cross is still underway, which is an extremely bearish medium-term signal. The LTC / USD pair’s 50-day moving average is located at the $63.50 level, while the 200-day moving average is found at the $87.00 level.
Downside Potential
The four-hour time frame is currently showing that the short-term trend is extremely bearish while price trades under the $60.00 level. The mentioned time frame is showing the $40.00 level as upcoming technical support.
The daily time frame is showing that price is trading under the neckline of a large head and shoulders pattern, with the $36.00 level as the likely bearish target.
Summary
Litecoin is under increasing downside pressure and risks a heavy double-digit decline if a sustained breach of the $50.00 level occurs.
Technical analysis on the daily and the weekly time frames are both showing the $35.00 to $36.00 levels as possible downside targets.
Check out our coin guide for an introduction to Litecoin.
We also wrote a DARE (Digital Asset Report and Evaluation) for the project, analyzing the future prospects of the Bitcoin competitor.