Litecoin Price Analysis LTC / USD: More Thrust Required
LTC has been saved, but further moves will be difficult.

Share this article
- Litecoin has a bearish short-term trading bias and retains a negative medium-term outlook
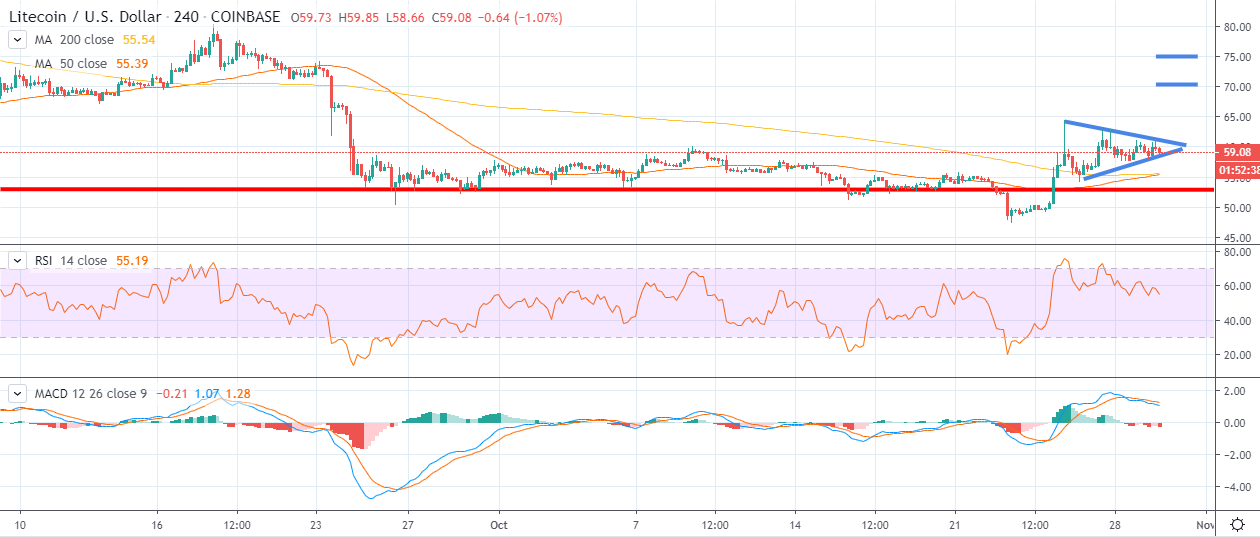
- The four-hour time frame shows that a bearish head and shoulders pattern has been invalidated
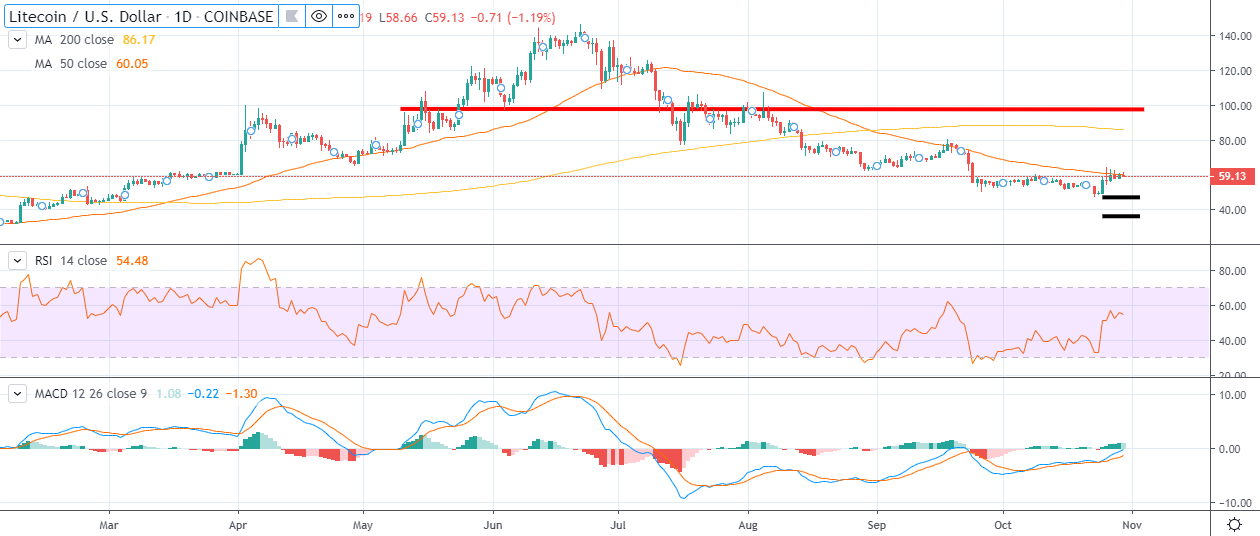
- The daily time frame shows bulls need to rally price towards the $85.00 level to secure the LTC / USD pair’s medium-term prospect
Litecoin received a much-needed reprieve on the cryptocurrency market last week, when the broader market rally saved the LTC / USD pair from a worsening decline below the $50.00 level.
The recent bounce-back in the LTC / USD pair has so far found resistance from just above the $60.00 level, which coincides with the Litecoin’s 50-day moving average.
Last week’s move higher helped negate a bearish head and shoulders pattern on the four-hour time frame, which threatened to sink the cryptocurrency towards the $36.00 level.
The invalidation target of the bearish pattern was also located around the $60.00 level, which is another major reason why the recent rally has stalled around this region.
Going forward, short-term technical analysis is signaling that the LTC / USD pair can advance towards the $70.00 and $75.00 region if price holds above the $60.00 level.
Furthermore, the four-hour time frame shows that the LTC / USD pair is now technically bullish in the short-term for the first time since September 21st this year. Ideally bulls need to defend to the $55.00 level to keep this dynamic in play.
Medium-term analysis suggests the path ahead is slightly more complicated for the LTC / USD pair. Buyers will need to rally the pair towards the $85.00 level to change the negative medium-term bias surrounding the cryptocurrency.
This would mean a rally of around 40 percent is needed from current trading levels. Furthermore, a lack of bullish patterns on the higher time frames is indicating that this may prove tricky without a fundamental catalyst.
According to the latest sentiment data from TheTIE.io, the short-term sentiment towards Litecoin is bearish, at 19.00 %, while the overall long-term sentiment towards the cryptocurrency is also negative, at 22.00%.
Upside Potential
The four-hour time frame shows that a bullish inverted head and shoulders pattern with an upside target of around $20.00 could start to form if a corrective move back towards the $55.00 level takes place.
Key upcoming resistance for the LTC / USD pair is now located at the $70.00 and $75.00 level. Traders should note that the $85.00 resistance is where the LTC / USD pair’s 200-day moving average is currently located.
Downside Potential
The four-hour time frame is showing that the $55.00 level is providing the strongest form of technical support, prior to the $50.00 level.
The daily time frame illustrates that a sustained drop below the $47.00 level would be extremely negative for the LTC / USD pair, and it may expose a decline towards the $36.00 level.
Summary
Litecoin received a much-needed boost last week, bringing the cryptocurrency away from the $50.00 support level.
Going forward, bulls need to mount a power rally of some 40 percent to secure the LTC / USD pair’s medium-term prospects.
Check out our coin guide for an introduction to Litecoin.
We also wrote a DARE (Digital Asset Report and Evaluation) for the project, analyzing the future prospects of the Bitcoin competitor.
Share this article
