Litecoin Price Analysis LTC / USD: Regression To Support
Litecoin is correcting short-term while keeping a stronger long-term outlook.

Share this article
- Litecoin has a bullish short-term trading bias, with cryptocurrency still trading above its 200-period moving average on the four-hour time frame
- The four-hour time frame is showing that the LTC / USD pair is testing back towards key neckline support
- The daily time frame continues to show that a valid bullish breakout is still underway
Litecoin / USD Short-term price analysis
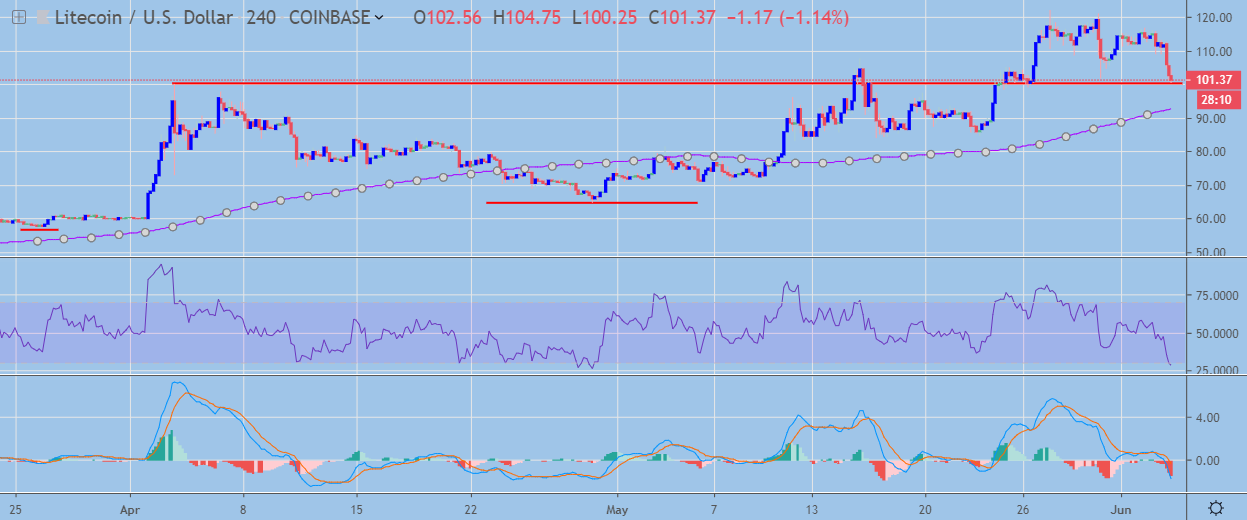
Litecoin still has a bullish short-term trading outlook, with the LTC / USD pair continuing to trade above its 200-period moving average on the four-hour time frame.
The four-hour time frame is showing that the LTC / USD pair is now testing back towards the neckline of a bullish inverted head and shoulders pattern. Critical support on the four-hour time frame is now found at the $92.00 and $84.40 levels.
Technical indicators on the four-hour time frame have turned bullish and continue to issue strong sell signals.
 LTC / USD H4 Chart by TradingView
Pattern Watch
Traders should note that a bearish double-top pattern has now formed on the four-hour time frame.
Relative Strength Index
The Relative Strength indicator is bearish on the four-hour time frame, although it has now reached oversold territory.
MACD Indicator
The MACD indicator has turned bearish on the four-hour time frame and is still issuing a sell signal.
Litecoin / USD Medium-term price analysis
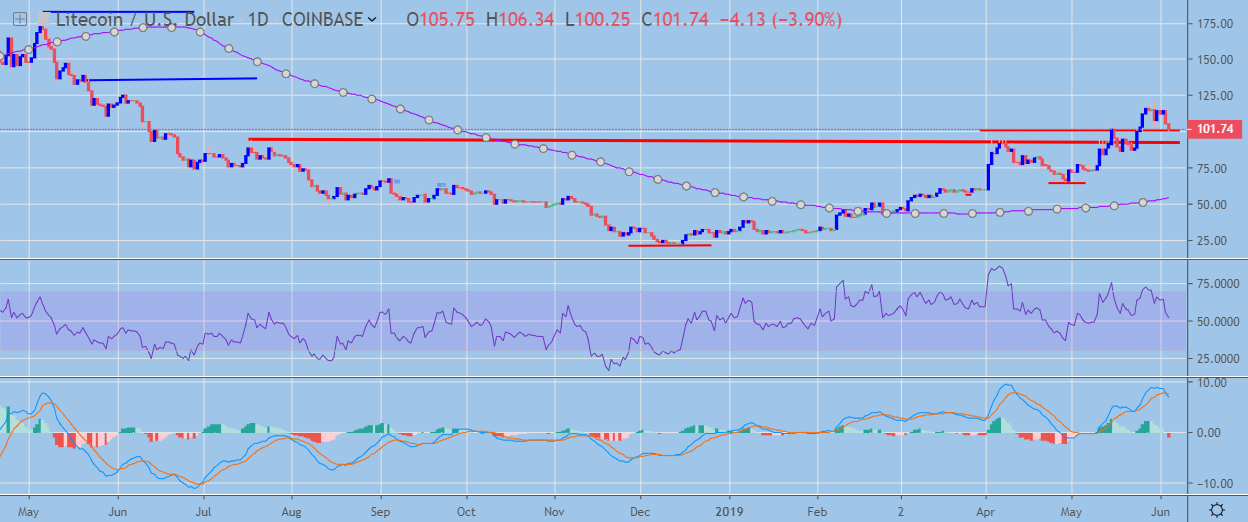
Litecoin has a bullish medium-term trading outlook, with the cryptocurrency still trading well above its 200-day moving average.
The daily time frame continues to show that a bullish technical breakout is still underway, despite the recent move lower. Key technical support on the mentioned time frame is now found at the $100.00 and $94.00 levels.
Technical indicators are moving lower and attempting to turn bearish on the daily time frame.
 LTC / USD Daily Chart by TradingView
Pattern Watch
Traders should note that a bearish breakout below the $100.00 support level is likely to increase technical selling.
Relative Strength Index
The Relative Strength indicator on the daily time frame is fast approaching neutral levels.
MACD Indicator
The MACD indicator is starting to turn bearish on the daily time frame, with the MACD signal line and histogram both turning lower.
Conclusion
Litecoin is undergoing a strong technical correction lower after a bearish double-top pattern formed across the four-hour time frame.
The daily frame continues to show a valid bullish breakout underway, although traders should be on guard for additional weakness in the LTC / USD pair if the $100.00 support level is convincingly breached.
Check out our coin guide for an introduction to Litecoin.
We also wrote a DARE for the project, analyzing the future prospects of the Bitcoin competitor.
