LTC / USD Price Analysis: Continuing Descent
Litecoin will continue with its bearish correction after it reached its highest level of the year.

Share this article
- Litecoin is neutral in the short-term, with the cryptocurrency testing back towards its 200-period moving average
- The LTC / USD pair retains its bullish medium-term outlook, with price holding firm above its 200-day moving average
- A large inverted head and shoulders pattern still remains valid on the daily time frame
LTC / USD Short-term price analysis
Litecoin has a neutral trading bias over the short-term, with the LTC / USD pair now testing back towards its 200-period moving average on the four-hour time frame.
The four-hour time frame is currently showing a triple top pattern formation, with the bearish pattern weighing on short-term trading sentiment.
Technical indicators on the four-hour time frame are bearish and continue to signal further losses.
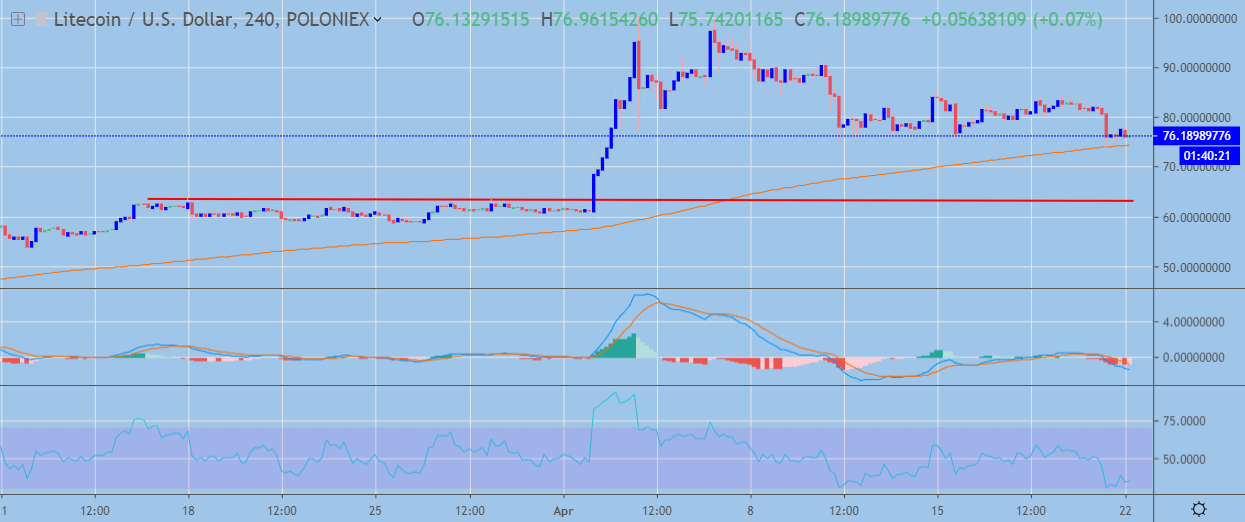 LTC / USD H4 Chart by TradingView
Pattern Watch
Traders should note that a small head and shoulders pattern can also be seen on the four-hour time frame with a $10.00 downside projection.
Relative Strength Index
The Relative Strength Index has turned bearish on the four-hour time frame, although it has now reached oversold conditions.
MACD Indicator
The MACD indicator has turned bearish, with the MACD signal line and histogram both issuing sell signals.
LTC / USD Medium-term price analysis
Litecoin has a bullish outlook over the medium-term, with the cryptocurrency still trading well above its trend defining 200-day moving average.
The daily time frame is showing that the LTC / USD pair is correcting lower after bulls failed to move price above the neckline of the large inverted head and shoulders pattern.
Technical indicators on the daily time frame are currently correcting from extremely overbought conditions.
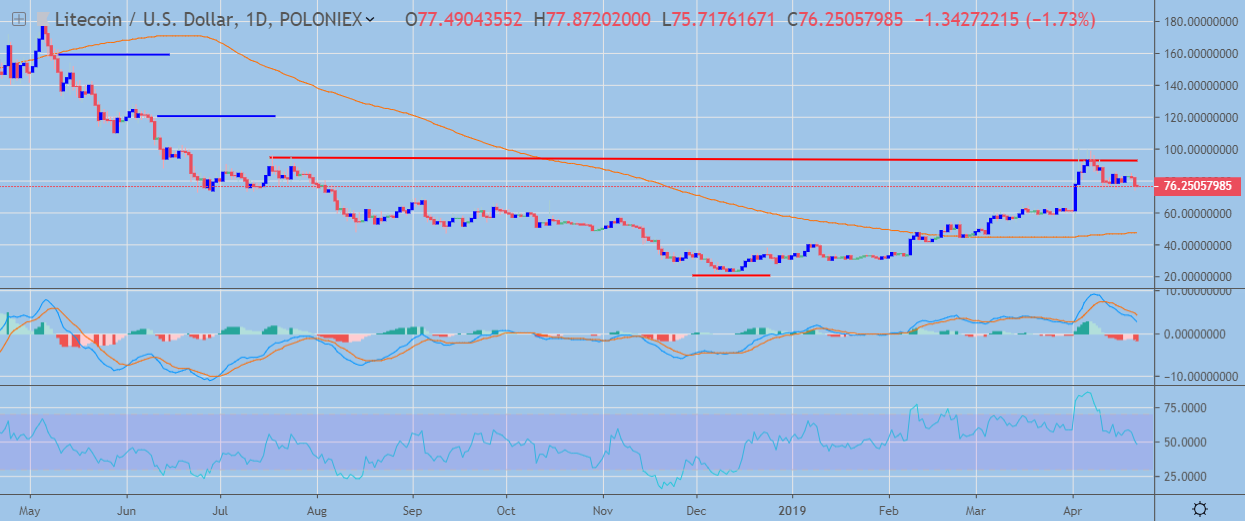 LTC / USD Daily Chart by TradingView
Pattern Watch
Traders should note that the inverted head and shoulders pattern on the daily time frame will remain valid if the LTC / USD pair trades above the $40.00 level.
Relative Strength Index
The Relative Strength indicator has turned bearish on the daily time frame and is signaling further downside.
MACD Indicator
The MACD indicator has turned bearish on the daily time frame, with both the MACD signal line and histogram both issuing sell signals.
Conclusion
Litecoin is still undergoing a technical correction lower following its early month advance towards the $98.00 level.
The bearish pattern on the four-hour time frame suggests further downside in the LTC / USD pair is possible, while the large inverted head and shoulders pattern on the daily time frame is still pointing to further upside over the medium-term.
We’ve released a coin guide on Charlie Lee’s Litecoin project.
A deeper dive into Litecoin is available in our DARE.
Share this article
