Photo: Decentraland
Metaverse Stars Decentraland, The Sandbox Face Correction
Decentraland and The Sandbox could be bound for significant losses as support weakens.
Decentraland and The Sandbox could be due for a correction as the global cryptocurrency market cap has tumbled below $2 trillion. Both tokens appear to be trading on weak support while selling pressure increases.
Decentraland Breaches Vital Support
Decentraland looks bound for significant losses after failing to overcome critical resistance.
The Metaverse game’s MANA token has seen its price drop by more than 23% over the past week. The downswing came after MANA was rejected from the upper boundary of a parallel channel its price has been contained in since early November 2021.
Now that Decentraland has breached the $2.25 support level, a steeper decline is possible.
Price history shows that MANA tends to retrace to the channel’s middle or lower trendline when the pattern’s upper edge rejects it. Similar price action could result in a 19% correction to $1.71. But if this support level fails to hold, MANA could dive further toward $1.21.
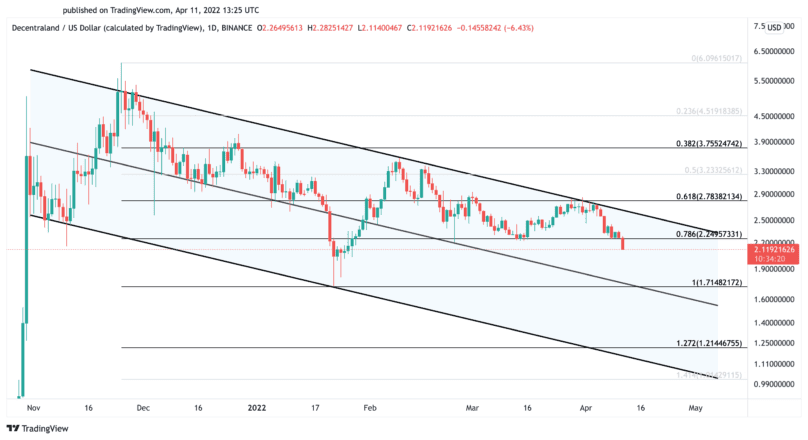
It is worth noting that a rise above $2.78 could invalidate the pessimistic outlook. Moving past the crucial resistance area could encourage sidelined investors to re-enter in the market. Under such unique circumstances, Decentraland could have the strength to surge to $3.75.
The Sandbox Hangs by a Thread
The Sandbox is holding above a critical area of support that bulls must defend to avoid further losses.
SAND has lost 0.84 points in market value over the past week. The sudden correction pushed the Metaverse token to the X-axis of a descending triangle it has been contained in since mid-November 2021. The Sandbox must now hold this level as support to avoid a correction.
The height of the triangle’s Y-axis anticipates that a decisive daily candlestick close below $2.56 could trigger an almost 68% retracement. Such a significant sell-off could see SAND dive to find support at $0.77.
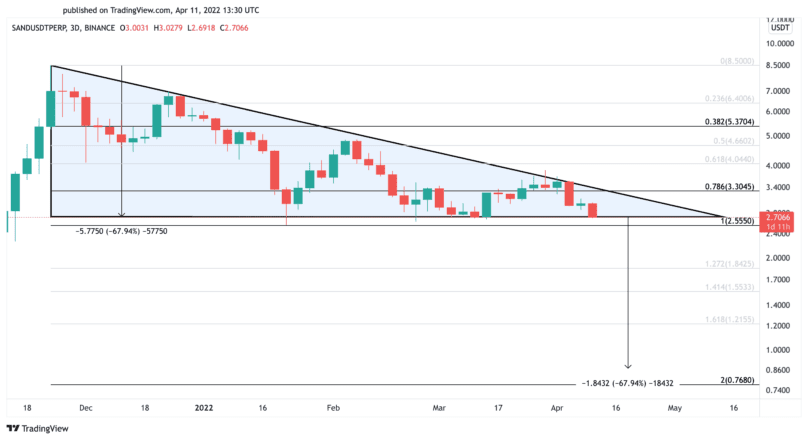
A push above $3.30 could invalidate SAND’s bearish thesis. A sustained daily close above this resistance level could trigger a breakout, pushing the Metaverse token toward $5.37.
Disclosure: At the time of writing, the author of this piece owned BTC and ETH.