 Earn with Nexo

Monero Price Analysis: Sustainable Recovery
XMR / USD Price Analysis - Monero is recovering from its losses and could gain even more, if buyers stage a rally above the $65.00 level.
- Monero has a bearish short-term and medium-term trading bias
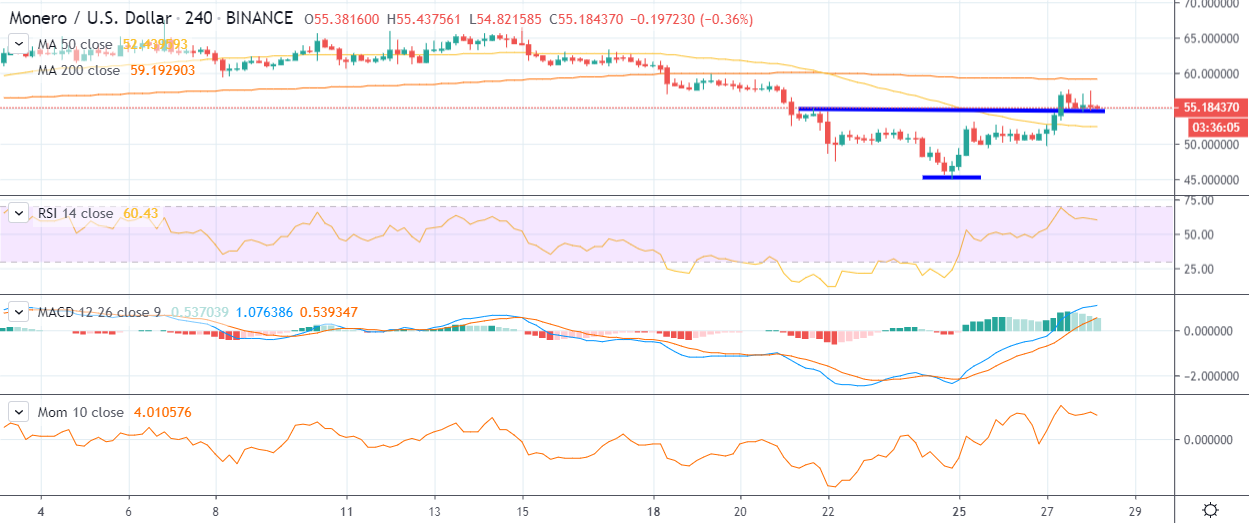
- The four-hour time frame shows that a bullish inverted head and shoulders pattern has been triggered
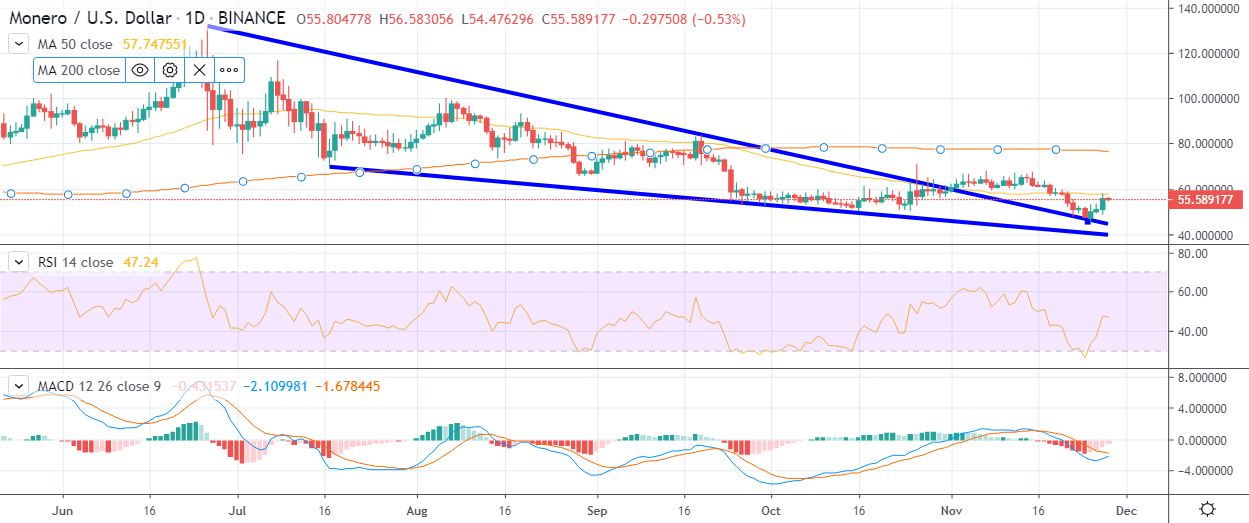
- The daily time frame shows the cryptocurrency has bounced from major trendline support
Monero has posted double-digit gains following a strong bullish reversal from $45.00. The cryptocurrency is now attempting to recover from an eight-month trading low.
The XMR/USD pair had declined by over 30 percent since the start of November and is currently trading around 58 percent below current 2019 trading high.
Technical analysis shows that the XMR/USD pair is still technically bearish over the short and medium-term, however, signs are emerging that the recent recovery could be sustainable.
The four-hour time frame shows that a small inverted head and shoulders pattern has recently been triggered, with the $65.00 level the overall upside objective of the bullish pattern target.
A rally towards $65.00 would also help to create a much larger reversal pattern that could eventually send the XMR/USD pair towards the $85.00 level.
The daily time frame shows that sellers tested the top of a falling wedge pattern during the recent decline, with buyers successfully defending the technical test.
The daily time frame shows that the XMR/USD pair will be in a prime position if buyers can accelerate the recent recovery towards the $78.00. This would help Monero recover above its 200-day moving average and reclaim its technically bullish status.
The Relative Strength Index on the daily time frame shows that the recent recovery is pulling the coin away from oversold positions.
According to the latest sentiment data from The TIE, the short-term sentiment towards Monero is neutral at 56.50 percent, while the overall long-term sentiment towards the cryptocurrency is neutral at 33 percent.
Upside Potential
A break above the $91.00 level would have the August 8 swing-high at $98.00 as the strongest form of technical resistance. The daily time frame currently shows four lower price highs, making a break above the most recent swing-high, at $91.00, technically very important.
The daily time frame highlights that the XMR / USD is trading below the 50-day moving average, at $87.00, but above its 200-day moving average, which is found at the $74.50 level.
Downside Potential
The four-hour time frame is showing that the XMR/USD pair has strong medium-term technical support around the $52.00 and $48.00 levels.
Critical long-term technical support for the XMR/USD pair is located at the $45.00 level.
Summary
Monero has staged a strong recovery from an eight-month trading low owing to the broader cryptocurrency market.
A sustained rally above the $65.00 level would help encourage traders to continue to buy the XMR/USD pair, with the $85.00 level the medium-term upside objective.