Nano Price Analysis NANO / USD: Big Dipper?
After failing to bring its price up, NANO's star is dimming.

Share this article
- Nano remains bearish over both the short-term and the medium-term
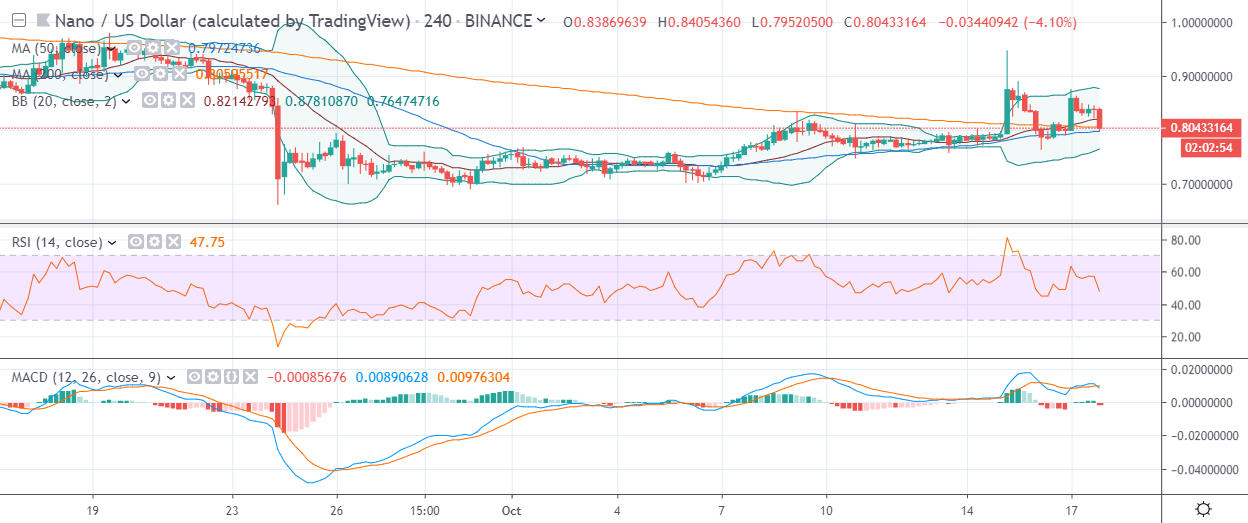
- The four-hour time is showing that bulls need to stabilize price above the $0.850000 level to increase buying interest.
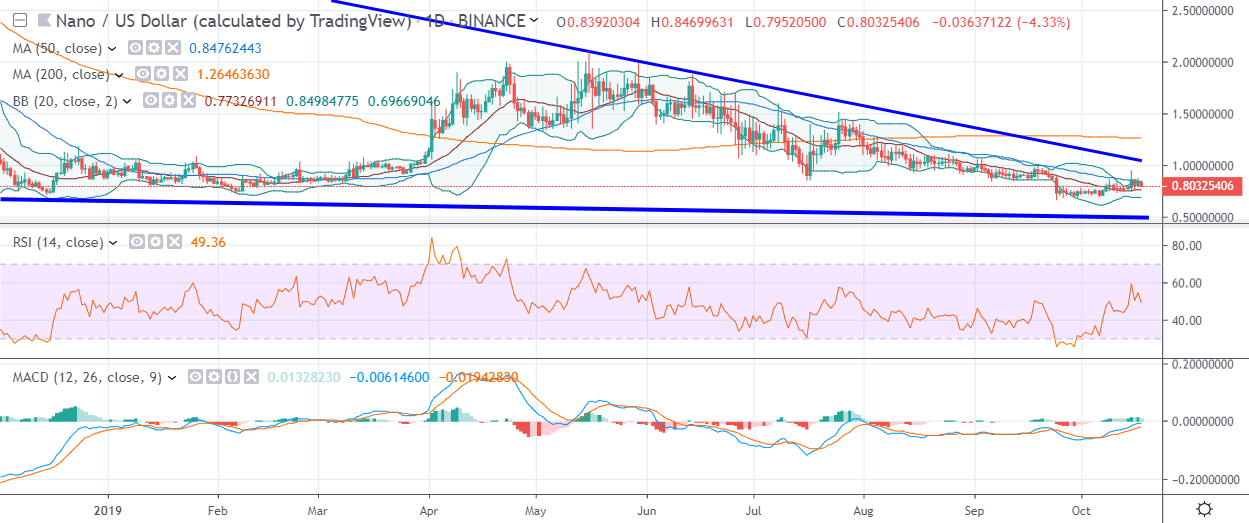
- The daily time frame shows that the cryptocurrency is trading inside a huge wedge pattern.
Nano is coming back under downside pressure towards the $0.800000 level, with the cryptocurrency eroding over fifteen percent of its early-month gains.
Up until October 16th, the NANO / USD pair had been one of the top performing cryptocurrencies, following a strong double-digit rally which added over thirty percent to its trading value.
The path ahead for the cryptocurrency is still uncertain, as key technical metrics across the four-hour and daily time frame are showing that the NANO / USD is still very bearish over the short and medium-term.
Looking at the four-hour time frame, NANO / USD buyers need to move price above the $0.870000 level to stabilize the cryptocurrency and change its short-term trading outlook.
The mentioned time frame is also lacking any bullish reversal patterns, which may indicate that a meaningful rally in the NANO / USD pair may not be forthcoming.
The daily time frame is currently showing that price is trapped inside a huge falling wedge pattern, which is a strong bullish reversal pattern, and a possible sign that the medium-term path ahead for the cryptocurrency could be higher.
At present, the top of the wedge pattern is located at the $1.030000 level, which is nearly thirty percent away from the current trading price.
Looking more closely the daily time frame, the cryptocurrency has failed to rally above its 50-day moving average, with the NANO / USD pair needing to rally by over fifty percent from current levels to trade back above its 200-day moving average.
According to the latest sentiment data from TheTIE.io, the short-term sentiment towards Nani is bullish, at 61.00 %, while the overall long-term sentiment towards the cryptocurrency is extremely positive, at 70.00%.
Upside Potential
The four-hour time frame highlights that bulls need to move price above the $0.870000 level to relieve short-term selling pressure. Once above the $0.870000 level, the NANO / USD pair has strong technical resistance around the $0.950000 level.
The daily time frame shows that a major technical breakout could occur if bulls rally price above the $1.030000 level. The NANO / USD pair’s 200-day moving average is located at the $1.266000 level.
Downside Potential
The four-hour time frame is currently showing that the short-term trend is bearish, with major technical support located at the $0.750000 and $0.680000 levels.
The daily time frame is showing that price could fall towards the $0.500000 level if a breakout occurs below the September trading low.
Summary
Nano is starting to erode its early-month trading gains, after a failed attempt to trade above the $1.00000 level.
Technical analysis on the daily time frame shows that a breakout from the $0.680000 to $1.030000 price range should provoke the next strong directional move in the NANO / USD pair.
Check out our Nano coin guide for a quick introduction to the project.
Share this article
