
Shutterstock cover by Peter Fuzia
Polkadot and Kusama Look Ready to Retrace
Polkadot and Kusama have risen by more than 13% over the past three days.
Polkadot and Kusama look set for brief retracements after reaching critical obstacles on their respective uptrends.
Polkadot Meets Resistance
Polkadot and Kusama appear to have reached crucial resistance barriers.
Polkadot has been on a roll lately, gaining over 13% in market value over the past three days. DOT jumped from a low of $18.30 to a high of $20.70. However, despite the significant spike in upward pressure, it could now be bound for a brief correction.
DOT’s price action has been contained in the upper boundary of a parallel channel, which is where the recent upswing may be rejected. Price history shows that the asset has retraced every time it has hit this crucial hurdle since early March. Similar price action could result in a correction to the pattern’s lower trendline at $18.90.
The Tom DeMark (TD) Sequential indicator adds credence to the short-term pessimistic outlook as it is currently presenting a sell signal on DOT’s four-hour chart. The bearish formation developed as green nine candlesticks, which is indicative of a one to four candlestick retracement.
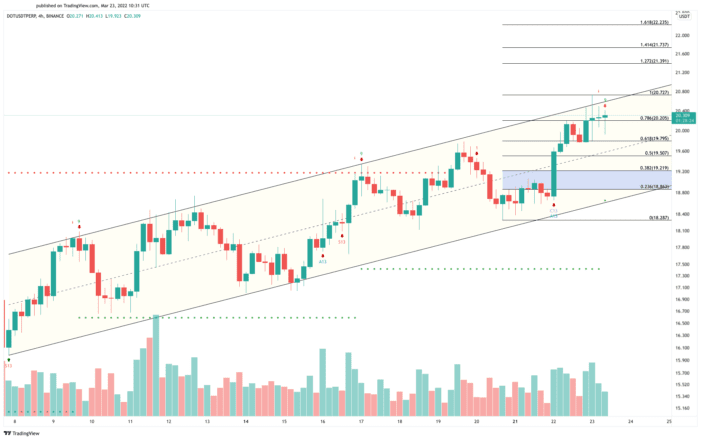
While the odds favor the bears, the $20.80 resistance level is crucial. A sustained four-hour candlestick close above this hurdle could invalidate the bearish thesis and encourage sidelined investors to get back in the market. The potential increase in buying pressure might have the strength to push Polkadot toward $22 instead.
Kusama Bound for Profit-Taking
Kusama appears to be nearing overbought territory as sell signals begin to emerge.
Polkadot’s canary network has seen its market value rise by nearly 14% over the past three days amid the surging interest in DOT. The upswing has added momentum to the winning streak that KSM has experienced since Mar. 14. Still, traders could be positioning themselves for a spike in profit-taking.
The TD Sequential indicators have presented a sell signal in the form of a green nine candlestick on Kusama’s daily chart. It anticipates that an increase in downward pressure could result in a steep correction that lasts one to four days.
If sell orders begin to increase around the current price levels, KSM could retrace toward the $142 to $128 support zone before attempting to resume its uptrend.
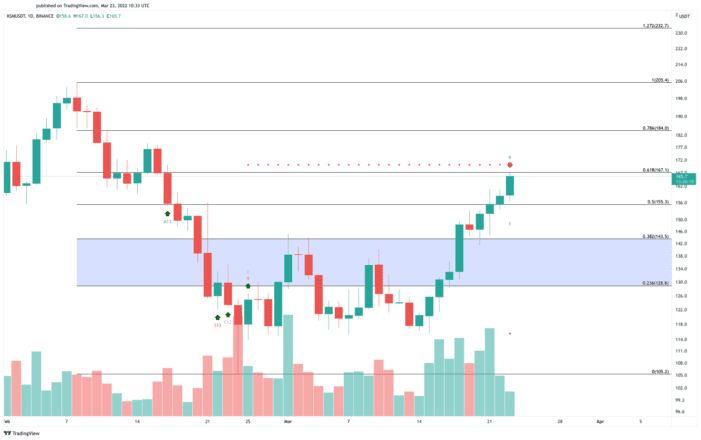
Kusama faces a cluster of resistance ahead, represented by the TD’s setup trendline and the 61.8% Fibonacci retracement level. These hurdles respectively sit at $172 and $167. Breaching the important supply zone could invalidate the pessimistic outlook, potentially leading to an upswing to $184.
Disclosure: At the time of writing, the author of this piece owned BTC and ETH.