 Earn with Nexo

Ripple Price Analysis XRP / USD: Bearish Breakout
XRP is under heavy selling pressure.
- Ripple has a bearish short-term and short-term trading bias
- The four-hour time frame shows that a bearish trendline break has occurred
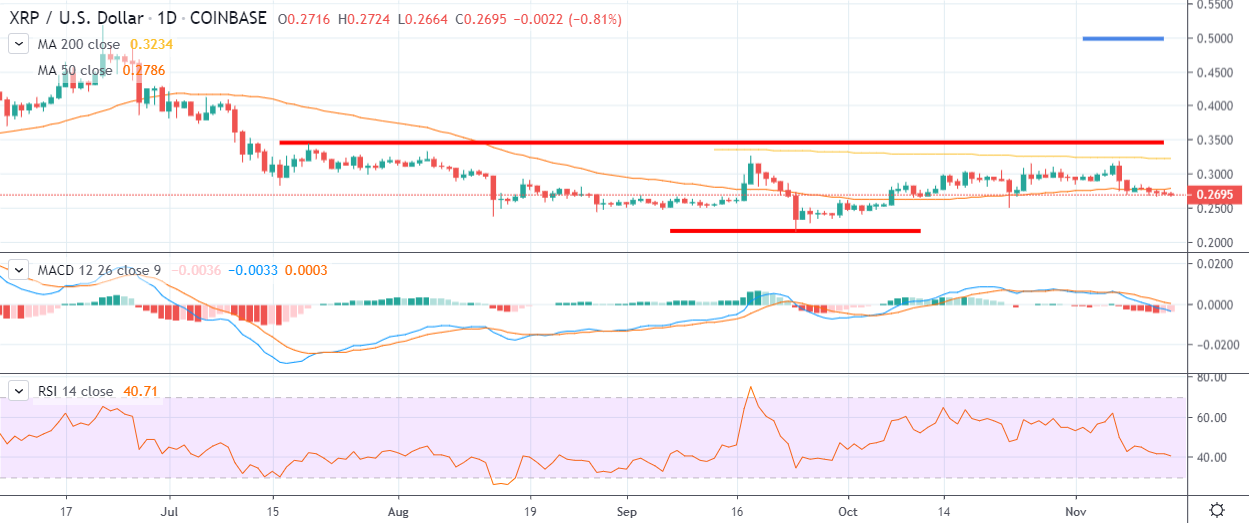
- The daily time frame is showing that a valid inverted head and shoulders pattern remains in play
Ripple is back under heavy downside pressure, following a sustained bearish breakdown under the psychological $0.30 support level. The cryptocurrency is now at serious risk of falling back towards its current yearly trading low.
With bearish momentum growing, the XRP / USD pair has shed around 5% of its value since the start of the week and now trades down by around 15% on a monthly basis.
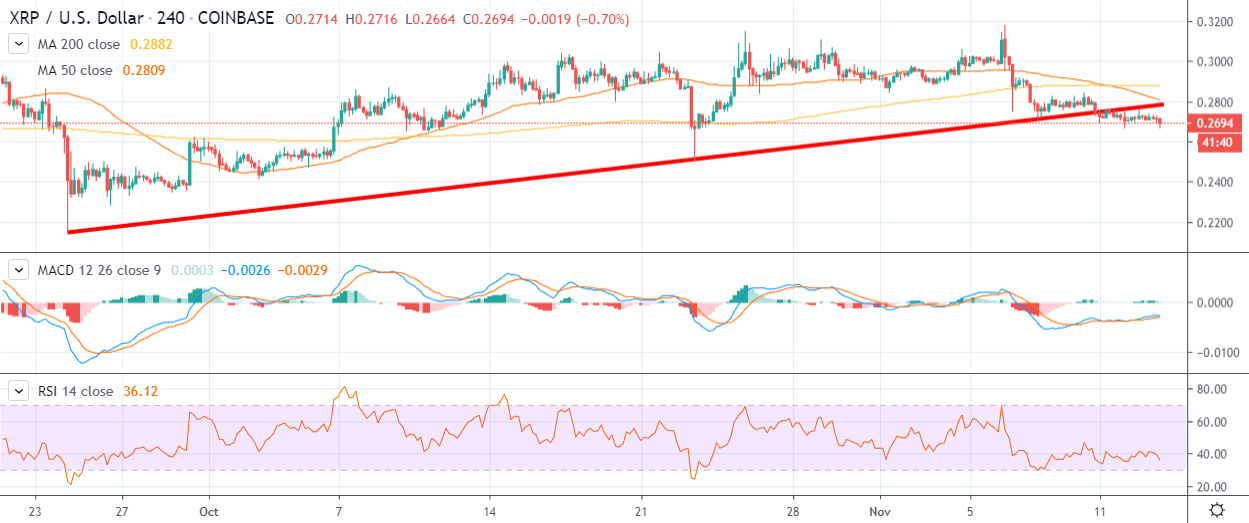
The XRP / USD pair has lost its bullish short-term trading bias since falling under its 200-period moving average on the four-hour time. Furthermore, the price action surrounding the cryptocurrency has been extremely bearish since the loss of the $0.30 level last week.
The four-hour time frame also shows that a bearish trendline break has occurred, with the cryptocurrency vulnerable to further declines while trading under the $0.28 level.
Higher time frame analysis shows that a bullish inverted head and shoulders pattern will be invalidated if buyers fail to defend the $0.25 support level.
It is imperative that that the bullish pattern remains valid, as the pattern has an upside projection that could take the XRP / USD towards the $0.50 level over the medium-term.
If the bearish pattern is invalidated the XRP / USD pair could fall towards the currently yearly trading low, around the $0.21 level. The overall invalidation target of the bullish pattern could take the XRP / USD pair towards the $0.18 support level.
According to the latest sentiment data from TheTIE.io, the short-term sentiment towards Ripple is neutral, at 52.00 %, while the overall long-term sentiment towards the cryptocurrency is also neutral, at 50.00%.
Upside Potential
The four-hour time frame shows that buyers must reclaim the $0.28 level in order to regain the XRP / USD pair’s bullish short-term trading bias.
Key technical resistance for the XRP/ USD pair above the $0.28 level is currently located at the $0.29 and $0.30 levels.
Downside Potential
The four-hour time frame is showing that the XRP / USD pair has strong short-term technical support around the $0.25 level.
Key technical support below the $0.25 level is currently found at the $0.23 level and the current 2019 trading low, around the $0.21 support level.
Summary
Ripple has seen a bearish sentiment shift since falling below the psychological $0.30 level.
Going forward, if the $0.25 support level is broken the XRP / USD pair’s medium-term trading prospects could suffer a severe setback.
Find out more about Ripple and XRP in our coin guide.
A deeper look into the merits of the project can be found in our SIMETRI Report.