
Ripple Price Analysis XRP / USD: Sights Set High
XRP is looking good on both timeframes and could reach the $0.4500 level.
- Ripple has a bullish short-term trading bias, but remains bearish over the medium-term
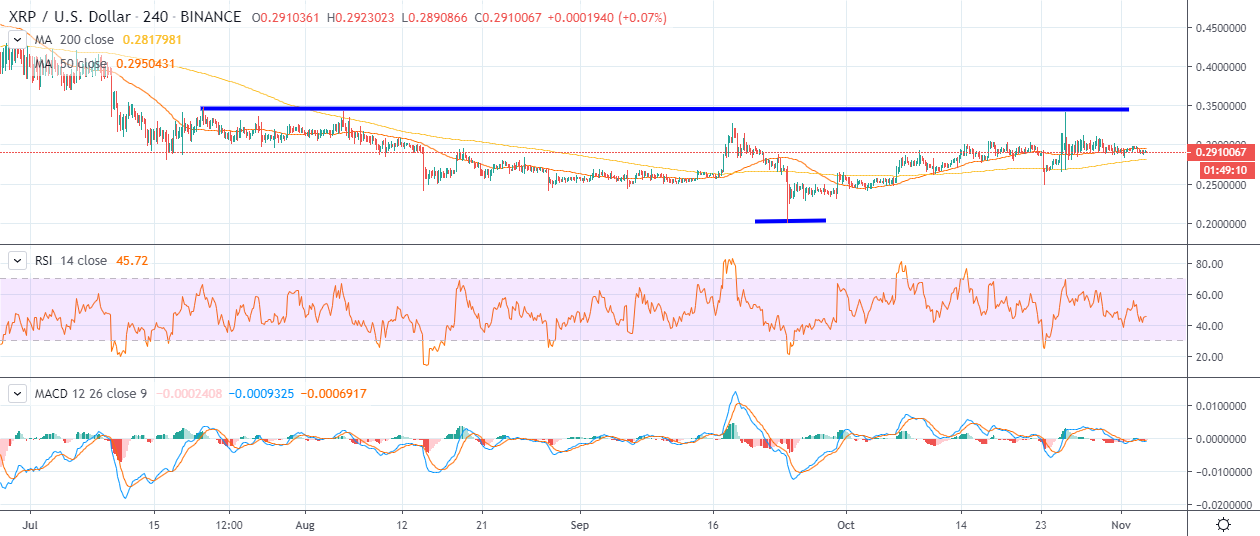
- The four-hour time frame shows an extremely large inverted head and shoulders pattern
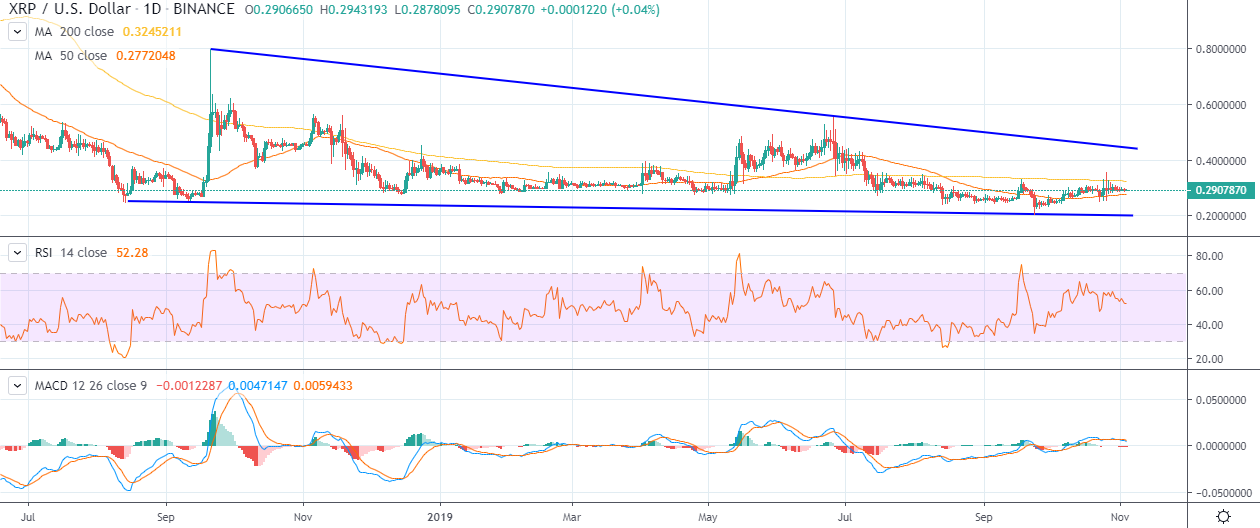
- The daily time frame shows a large descending triangle pattern
Ripple continues to struggle to forge a meaningful breakout above the $0.3000 level, despite the cryptocurrency having increasingly impressive technicals across both the lower and higher time frames.
The sharp reversal from the $0.2000 level in September and the bullish higher monthly low around the $0.2500 level has helped to form an impressive inverted head and shoulders pattern across the lower time frames.
The four-hour time frame shows that a rally towards the $0.4500 level could occur if XRP / USD buyers can rally price above the $0.3450 level. According to the size of the pattern, the XRP / USD would add roughly thirty percent to its value if the bullish breakout occurred.
In the near-term, XRP / USD buyers need to hold price above the psychological $0.3000 level in order to encourage the next push higher. Sustained strength above Ripple’s 200-day moving average, at the $0.3250 level, is also critical to attracting fresh technical buyers.
The daily time frame also shows a large descending triangle, with the top of the price channel coinciding with the upside projection of the bullish inverted head and shoulders pattern, around the $0.4500 level.
Looking at the medium-term downside potential for the XRP / USD pair, a loss of the $0.2500 level would be extremely bearish for the cryptocurrency and may prompt a technical test towards the October trading low, around the $0.2350 level.
At present, the XRP / USD pair is well-supported on pullback towards the $0.2800 level and does not appear in any imminent danger. Short-term sellers will, however, gain traction if the $0.2800 support level is overcome.
According to the latest sentiment data from TheTIE.io, the short-term sentiment towards Ripple is neutral, at 44.00 %, while the overall long-term sentiment towards the cryptocurrency is bearish, at 36.00%.
Upside Potential
The four-hour time frame shows that a large inverted head and shoulders pattern has formed, with the $0.3450 level acting as the neckline of the bullish pattern.
Key technical resistance before the $0.3450 level is currently located at the $0.3000 and the $0.3250 level. Medium-term resistance for the XRP / USD pair is found at the $0.4000 and $0.4500 levels.
Downside Potential
The four-hour time frame is showing that the $0.2800 level is providing the strongest form of short-term technical support below the pivotal $0.3000 level.
The daily time frame shows that a break below the $0.2500 level would be extremely bearish for the XRP / USD pair and could prompt a decline towards the $0.2350 and possibly the $0.2000 levels.
Summary
Ripple has improving short and medium-term technicals, with both the four-hour and daily time frame highlighting the $0.4500 level as a potential upcoming price target.
In the near-term, it is critical that XRP / USD bulls gain the upper hand above the $0.3250 resistance level.
Find out more about Ripple and XRP in our coin guide.
A deeper look into the merits of the project can be found in our SIMETRI Report.