
Ripple-Promoted Token Price Analysis XRP / USD: Overcoming Limits
XRP is preparing to face its resistance level, once again.
- Ripple has turned bullish over the short-term, but remains medium-term bearish while trading below the $0.3400 level
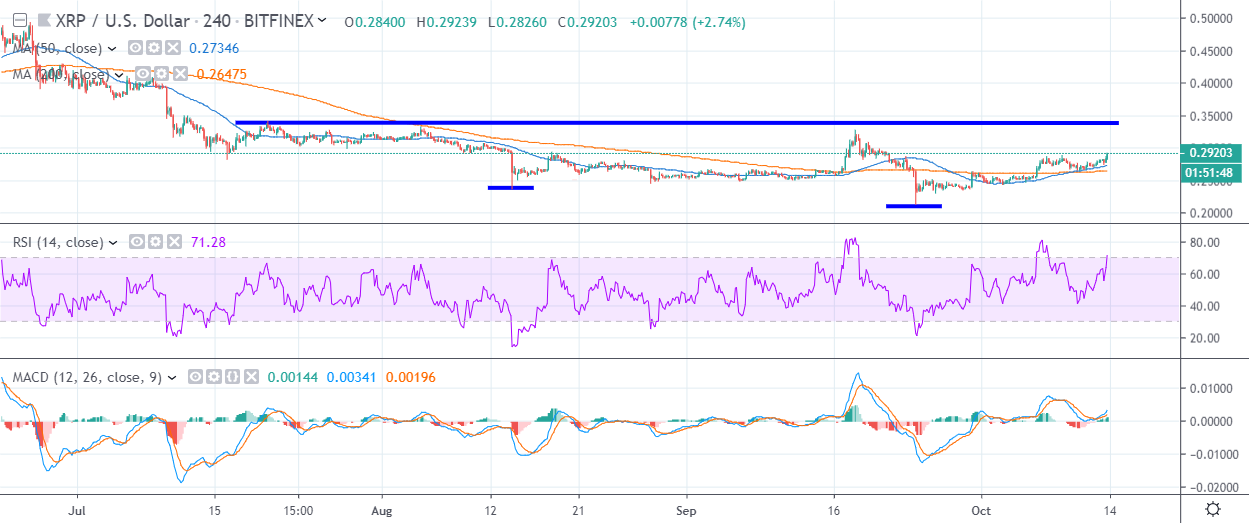
- The four-hour time shows that a bullish inverted head and shoulders pattern may be forming
- The XRP / USD pair faces a major technical battle with the $0.3000 level
Ripple is on the rise, after the third-largest digital asset found strong dip-buying demand from the $0.2650 level last week. The cryptocurrency has been gradually gaining bullish momentum, since recovering from the $0.2140 level last month.
The sharp rebound from the $0.2130 level, coupled with an emerging bullish pattern on the four-hour time frame suggests that a medium to long-term price floor in the cryptocurrency may have been formed last month.
The XRP / USD pair has gained over fifteen percent in value since the start of the month and has reclaimed over thirty-five percent from its September monthly trading low. Going forward, the cryptocurrency faces a major technical battle with the $0.3000 level.
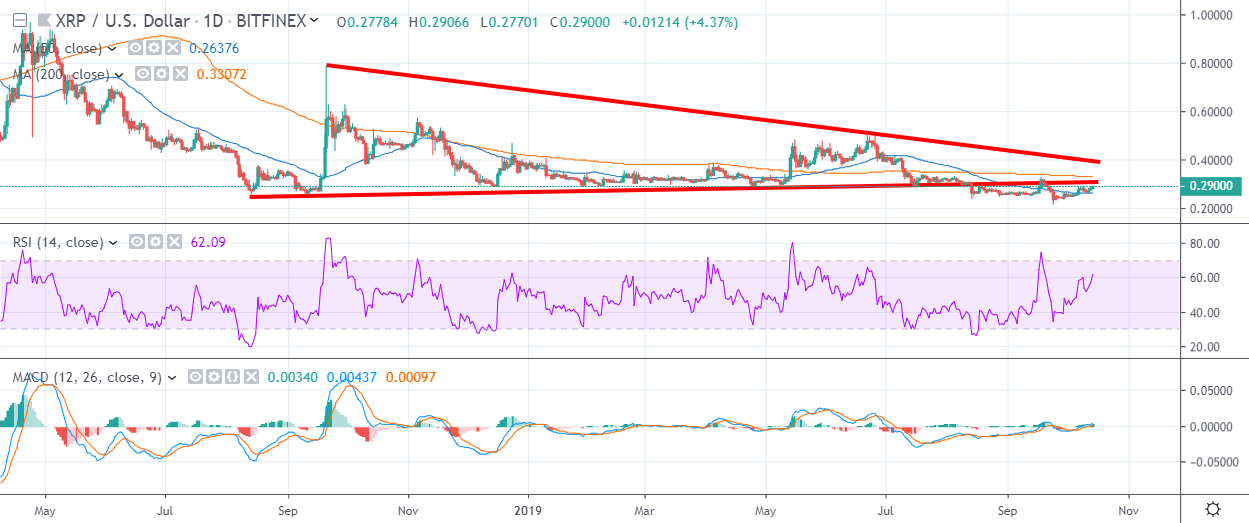
The $0.3000 level currently denotes major trendline resistance from a long-standing triangle pattern on the daily time frame. The $0.3000 level has also acted as a key psychological level that traders regularly observe. The loss of the $0.3000 level in August provoked a bearish sentiment shift in the cryptocurrency, which eventually culminated in the late September plunge towards the $0.2000 level.
The four-hour time frame is showing that if buyers can rally the XRP / USD pair towards the $0.3400 level, then a bullish inverted head and shoulders pattern with a substantial upside projection will form. The overall upside projection of the pattern would take the XRP / USD pair towards the $43.00 level.
Furthermore, the XRP / USD pair’s 200-day moving average is located around the $0.3400 level. The odds are high that bulls will test towards the $0.3400 level if they can stabilize price above the $0.3000 level over the coming sessions.
According to the latest sentiment data from TheTIE.io, the short-term sentiment towards Ripple is neutral, at 57.980 %, while the overall long-term sentiment towards the cryptocurrency is fairly bearish, at 38.00%.
Upside Potential
The four-hour time frame highlights that the September 18th swing-high, around the $0.3270 level, currently offers the strongest form of resistance above the $0.3000 level.
The daily time frame highlights the $0.3400 level as major technical resistance if bulls gain strength above the $0.3270 level. Traders should watch for a major technical breakout if bulls gain strength above the $0.3270 level.
Downside Potential
The four-hour time frame is showing that major short-term support for the XRP / USD pair is currently located at the $0.2730 and $0.2640 levels.
The daily time frame is showing that a loss of the XRP / USD pair’s 50-day moving average would be extremely bearish for the cryptocurrency. The 50-day moving average is currently located around the $0.2620 level.
Summary
Ripple is approaching major technical resistance around the $0.3000 level, after gaining around fifteen percent in value so far this month.
Both the lower and medium-term time frames highlight that a move above the $0.3400 level could provoke a major bullish breakout in the XRP / USD pair.
Find out more about Ripple and XRP in our coin guide.
A deeper look into the merits of the project can be found in our SIMETRI Report.