Solana and Avalanche on Brink of Possible Breakout
Solana and Avalanche have kicked off the week in a positive posture but are yet to overcome significant resistance.

Key Takeaways
- Solana and Avalanche have surged by over 15% Monday.
- Both Layer 1 tokens are testing vital areas of resistance.
- Further buying pressure could send SOL to $62 and AVAX to $27.
Share this article
Solana and Avalanche have risen by more than 15% Monday morning. The upward price action has pushed both Layer 1 tokens to crucial areas of resistance, hinting at a bullish week ahead.
Solana and Avalanche Test Resistance
Upward volatility has returned to the cryptocurrency market, and Solana and Avalanche appear to be benefiting from it.
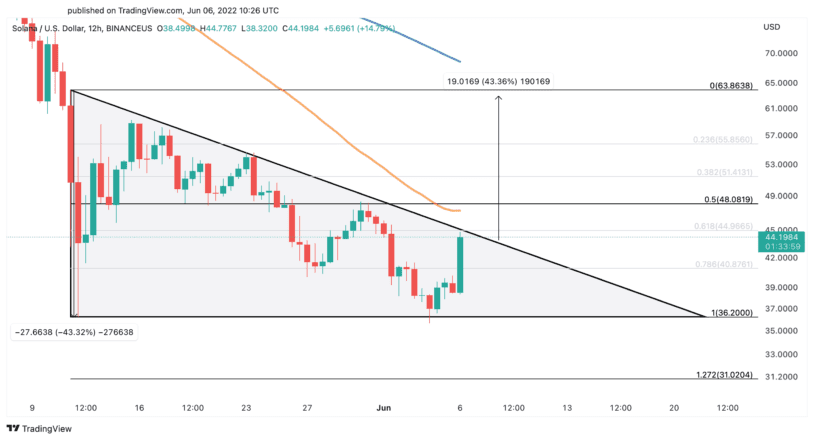
SOL has seen its price increase by more than 15% Monday, jumping from a low of $38.50 to hit a recent high of $44.80. Further upward pressure could help propel Solana through resistance and advance higher.
From a technical perspective, Solana appears to have formed a descending triangle on its 12-hour chart. The recent upswing has pushed SOL closer to the pattern’s hypotenuse, hinting at a potential breakout. Still, the Layer 1 token needs to breach the 50-hour moving average at around $47 to validate this optimistic outlook.
If Solana manages to print a 12-hour candlestick close above the $47 resistance level, it could surge by more than 40% toward a target of $62.
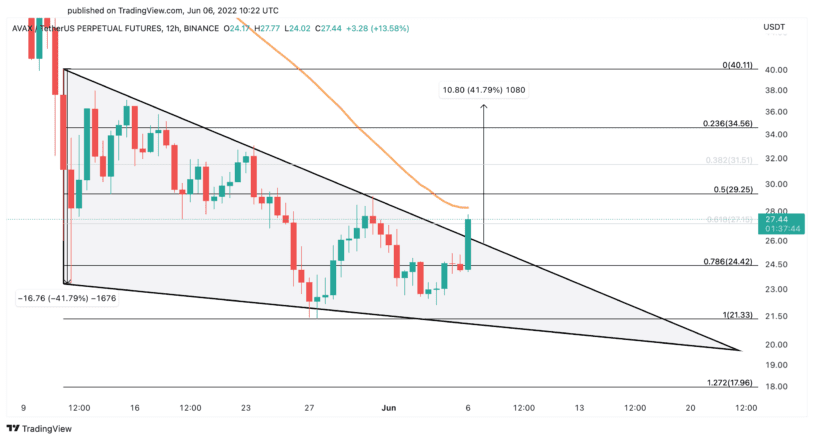
Technical indicators for Avalanche also show the potential for short-term advancement. The Layer 1 token has risen by nearly 15% since Monday’s open, overcoming a previous area of resistance. However, AVAX is yet to breach its subsequent supply barrier and post further gains.
Over the past few hours, the rising price action has allowed Avalanche to slice through the upper boundary of a falling wedge that developed on its 12-hour chart. This technical pattern now anticipates that AVAX can advance another 40% toward $37. whether Avalanche can push past the 50-hour moving average at $28 will likely confirm or invalidate this optimistic outlook.
Although the odds appear to favor the bulls, caution is advised around the current price levels. Failing to overcome resistance could generate uncertainty among market participants, leading to an increase in sell orders.
If this bearish scenario were to occur, Solana could potentially drop below $36 to invalidate the bullish thesis and dip down to $30. A similar movement could also affect Avalanche if it breaks its $21 support level, indicating a further decline to $18 is possible.
Disclosure: At the time of writing, the author of this piece owned BTC and ETH.
Share this article
