Solana, Avalanche Meet Stiff Resistance
Solana and Avalanche are showing early signs of exhaustion. Both assets could soon retrace.

Key Takeaways
- Solana and Avalanche are trading below significant supply zones.
- Failing to overcome these hurdles could trigger corrections.
- SOL needs to close above $46, while AVAX needs to break above $31 to advance higher.
Share this article
While Ethereum is rallying in the lead-up to the network’s “Merge” upgrade, Solana and Avalanche appear to be bound for brief corrections.
Solana and Avalanche Shows Signs of Weakness
Solana and Avalanche appear to have reached critical areas of resistance after posting significant gains in the last 24 hours.
SOL jumped by more than 15% over the past 24 hours, rising from a low of $39.2 to a high of $45.1. The sudden upswing appears to correlate with Wednesday’s update that U.S. inflation had cooled to 8.5% in July, which led to a rally across global markets. However, in the crypto space today, market participants now appear more focused on Ethereum as the “the Merge” upgrade edges closer.
The sentiment shift could take a toll on Solana’s price action. If SOL fails to print a four-hour candlestick close above the $46 resistance level, a correction toward $40 could be imminent. SOL must overcome this hurdle to be able to advance further.
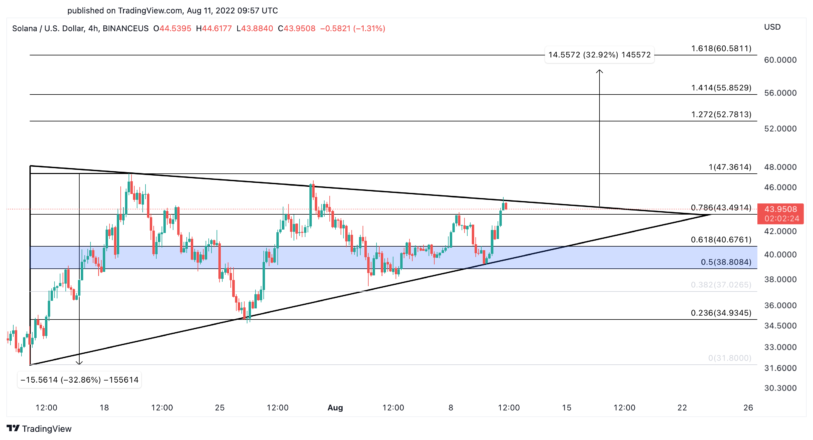
The formation of a symmetrical triangle on Solana’s four-hour chart suggests it could enter a 33% uptrend toward $60, but it must break past $46 first.
Avalanche has also enjoyed significant bullish momentum over the past 24 hours, rising by more than 10%. From a technical perspective, the uptrend appears to have derived after AVAX broke out of a head-and-shoulders pattern. Now that the token nearly reached the pattern’s target of $31.50, a sell signal is forming on the four-hour chart.
The Tom DeMark (TD) Sequential indicator has presented a green nine candlestick, indicative of a one to four candlestick correction. A spike in profit-taking that pushes Avalanche below $28.80 could validate the pessimistic outlook. If AVAX loses this vital support level, it could face a correction to $27.20 or even $26.20.
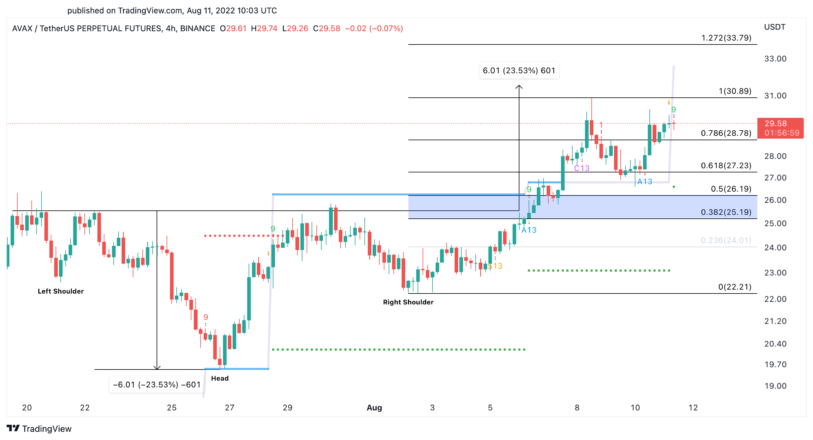
Given the market’s positive reaction to the latest U.S. Consumer Price Index report, further gains cannot be ruled out. If Avalanche can print a four-hour candlestick close above $31, it may gain the strength to invalidate the bearish thesis and rise to $34.
Disclosure: At the time of writing, the author of this piece owned BTC and ETH.
Share this article
