Solana on the Verge of Major Price Movement
Solana has entered a consolidation period that could result in a major price movement.
")
Key Takeaways
- Solana is up by more than 40% from the $36.20 low hit on May 12.
- Still, the token appears to be locked in a consolidation pattern.
- An hourly close outside the $49-$58.80 range could determine where SOL goes next.
Share this article
Solana is trading within a narrow range. The good news is that as prices squeeze, momentum builds for a significant spike in volatility.
Solana Shows Ambiguity
While the cryptocurrency market continues to suffer from Terra’s death spiral, Solana is on the verge of a significant price movement.
Solana ranks amongst the worst-performing cryptocurrencies in May. The Layer 1 blockchain saw its price drop by nearly 60% during the first 12 days of the month. Although SOL has rebounded by more than 40% from the swing low at $36.20, it is locked in a consolidation pattern that anticipates further volatility on the horizon.
The hourly chart reveals that Solana’s price action since May 11 has led to an ascending triangle formation. The series of swing highs appear to have created a horizontal resistance trendline around $58.80, while the swing lows developed a rising trendline. A breakout from this type of technical formation can occur to the upside and the downswing.
Still, the lack of trading volume in the cryptocurrency markets suggests that SOL could be bound for a steep correction. An hourly close below the triangle’s hypothenuse at $49 could encourage traders to exit their position and increase the selling pressure behind Solana. Under such circumstances, the Layer 1 token might dive toward $44 or even $40.
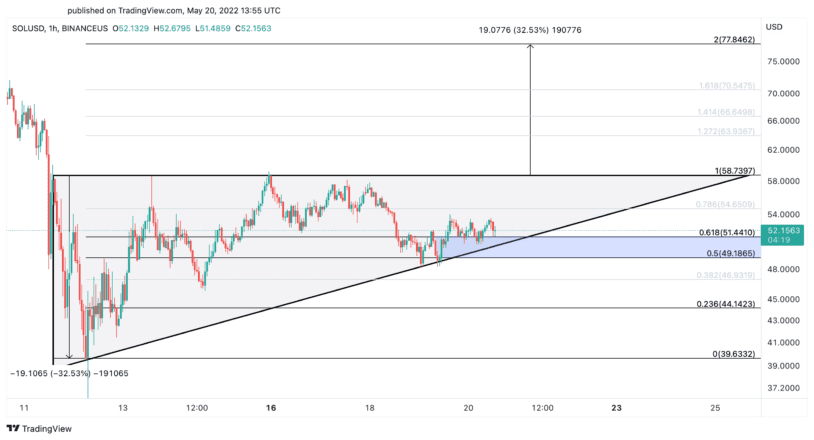
Given the magnitude of Solana’s losses over the past month, it is reasonable that some traders would maintain a bullish bias. But patience is required to avoid exposure to further risks. Only a sustained hourly close above the $58.80 resistance level would signal the beginning of a bullish impulse.
Slicing through such a vital supply wall could trigger a short squeeze that sends Solana to a high of $78. This target is determined by measuring the height of the triangle’s Y-axis and adding that distance upwards from the technical pattern’s X-axis.
Disclosure: At the time of writing, the author of this piece owned BTC and ETH.
Share this article
