Solana, Terra Reach Pivotal Support Areas
Solana and Terra have found support, but investors remain sidelined.

Key Takeaways
- Solana and Terra have seen their market value drop by more than 23% over the past week.
- Both Layer 1 tokens are now sitting at make-or-break points that will determine their fates.
- A break of support or resistance could result in a significant move for both assets.
Share this article
Solana and Terra have reached critical support areas after incurring significant losses over the past week. Still, buying pressure is yet to pick up for both assets.
Solana and Terra Reach Crucial Points
Solana and Terra have found important support levels.
The Layer 1 tokens appear to be trading at make-or-break points after retracing by more than 23% over the past week.
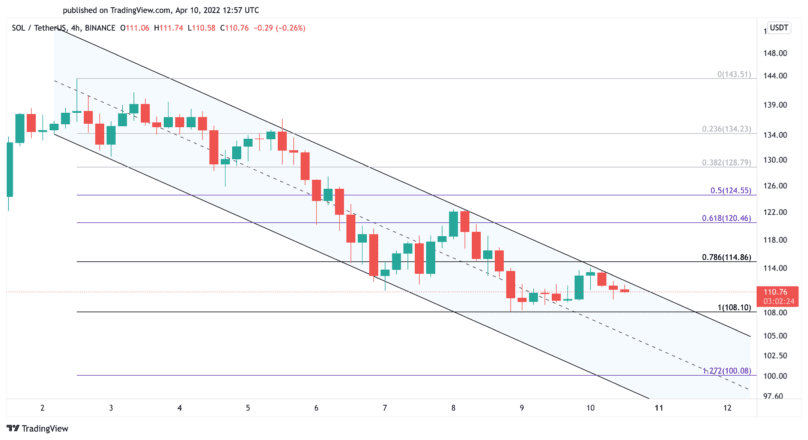
Solana is currently testing the upper boundary of the parallel channel that developed on its four-hour chart. Trading history shows that a rejection has occurred every time SOL has surged to this resistance trendline, leading prices to pull back to the channel’s lower edge.
A similar market reaction could see the Layer 1 token slice through the $108 support level and retrace 10% toward the channel’s lower trendline at around $100.
Still, as Solana has tested the channel’s upper boundary three times since Mar. 5, resistance could be weakening. SOL’s current price levels are critical because a decisive four-hour candlestick close above $115 could invalidate the pessimistic outlook. Breaching the crucial supply wall could result in an upswing to $124.
Terra’s native token is also sitting at a pivotal point on its trend. The Tom DeMark (TD) Sequential indicator recently presented a buy signal in the form of a red nine candlestick on LUNA’s 12-hour chart. The bullish formation anticipates a one to four candlesticks upswing, but buying pressure has not yet picked up.
The 100-hour exponential moving average at $91 within this time frame is the only level of support preventing LUNA from dropping further. Meanwhile, the 50-hour exponential moving average at $100 is acting as resistance, rejecting any upward price action. Only a 12-hour candlestick close outside of this price pocket can determine whether the optimistic thesis presented by the TD setup would be validated.
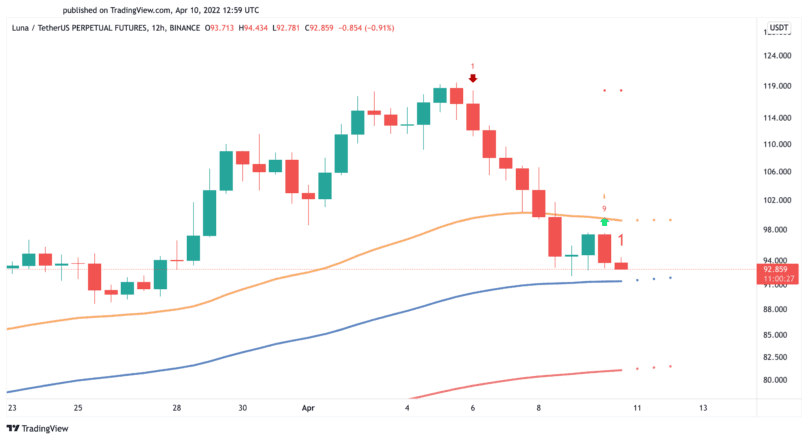
Due to the ambiguous outlook, traders will be looking to exercise patience around the current price levels. A decisive close above resistance could catapult LUNA to $110, while a breach of support could result in a downswing to $82.
Disclosure: At the time of writing, the author of this piece owned BTC and ETH.
Share this article
