Steem Price Analysis STEEM / USD: Catastrophic Loss
After falling deep, patterns predict further losses for STEEM.

Share this article
- Steem has a bearish short-term outlook, with the STEEM / USD pair trading below key support on the four-hour time
- The STEEM / USD pair has a bearish medium-term outlook with a death cross currently underway on the daily time frame
- The daily time frame shows that the cryptocurrency is starting to trade below the neckline of a large head and shoulders pattern remains present.
Steem / USD Short-term price analysis
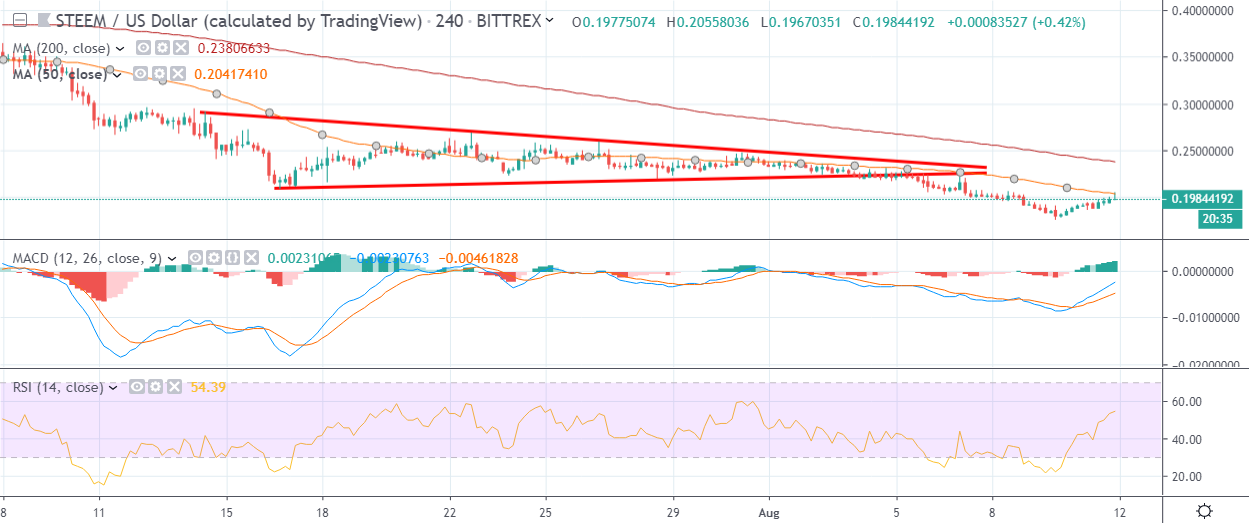
Steem has a bearish short-term outlook, with the cryptocurrency trading below all forms of major technical support on the four-hour time frame.
The four-hour time frame is showing that the STEEM / USD pair is undergoing a minor technical correction, following a bearish breakout from a well-defined triangle is currently underway.
Technical indicators on the four-hour time frame are bullish and still show scope for further upside.
Pattern Watch
Traders should note that the bearish breakout from the triangle pattern has yet to reach its overall downside projection.
Relative Strength Index
The RSI indicator has turned bullish on the four-hour time frame and still shows scope for further upside.
MACD Indicator
The MACD indicator on the four-hour time frame has turned bullish and is currently generating a buy signal.
Steem / USD Medium-term price analysis
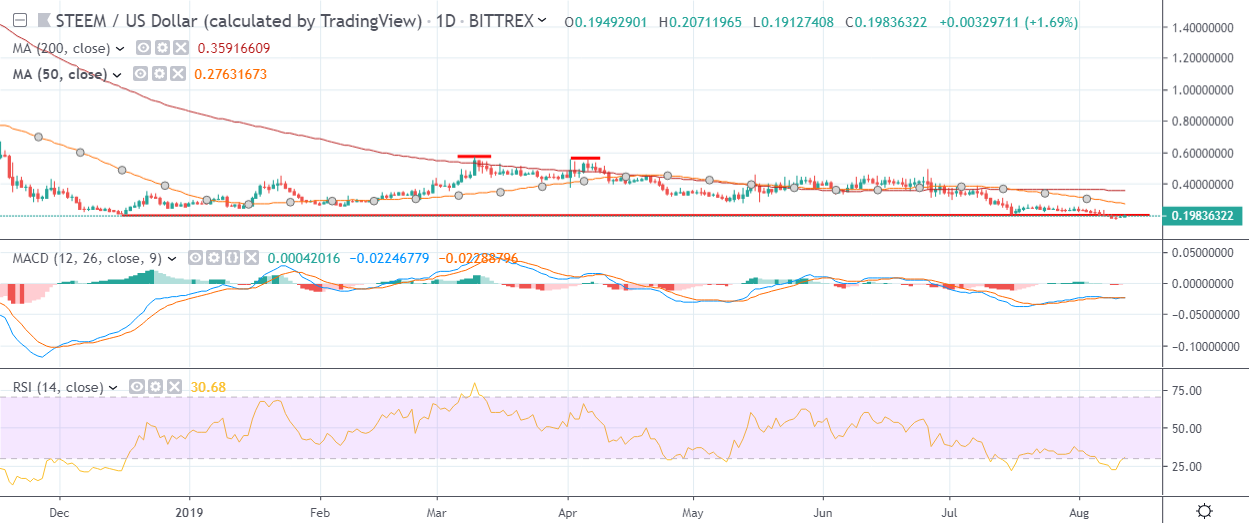
Steem has a bearish medium-term outlook, with the cryptocurrency trading at its weakest level since December last year.
The daily time frame is showing that a huge complex head and shoulders pattern has formed. A bearish death cross is also currently underway, with the 50-day moving average crossing over the 200-day moving average.
Technical indicators on the daily time frame are bearish, although they appear overstretched to the downside.
Pattern Watch
Traders should note that the STEEM / USD pair is now trading below the neckline of the bearish pattern on the daily time frame.
Relative Strength Index
The Relative Strength Index on the daily time frame is bearish, although it is attempting to recover from oversold conditions.
MACD Indicator
The MACD indicator on the daily time frame is bearish and is issuing a weak sell signal.
Conclusion
Steem is under major technical selling pressure across both time frames after repeatedly failing to rally and forming a large bearish price pattern.
The trading action is likely to be focused around the huge bearish pattern on the daily time frame, which suggests more medium-term losses for the STEEM / USD pair.
For an introduction to the Steemit platform and its token, check out our coin guide.
If you need a deeper analysis of the fundamentals, we recently released our DARE for Steem.
Share this article
