Stellar Lumen Price Analysis: Following the Market
Stellar is in a precarious position as it closely follows market fluctuations.

Share this article
- Stellar has a bearish short-term and medium-term trading outlook
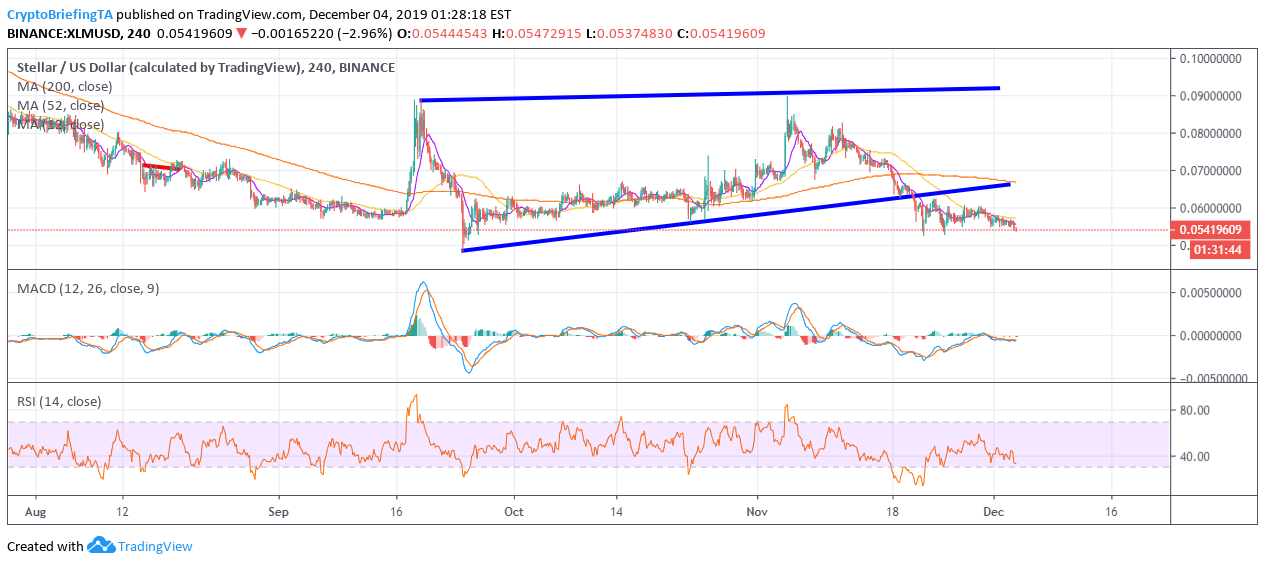
- The four-hour time frame shows that a bearish wedge breakout has taken place
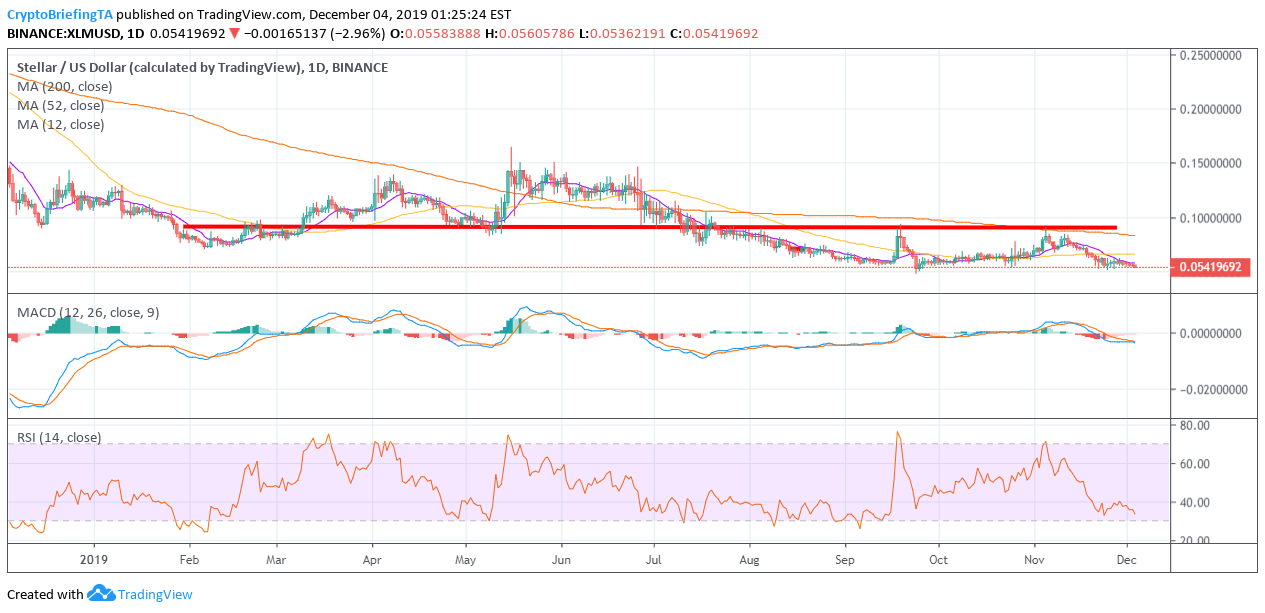
- The daily time frame shows that a bearish head and shoulders pattern has been triggered
Stellar Lumen remains under downside pressure, following its recent technical rejection from the $0.54 level as the downtrend still underway in the broader cryptocurrency market. XLM subsequently recovered to just above $0.56 at the time of writing, as a sudden BTC surge dragged the rest of the market with it.
The XLM/USD pair has nevertheless lost nearly 40 percent from its November price peak and is currently trading around one percent below its December opening price.
Technical analysis shows that the XLM/USD pair performed a bearish head and shoulders breakout on the daily time frame, moving the cryptocurrency back towards the November swing-low.
The four-hour time frame shows that a bearish breakout from a rising wedge pattern has taken place, which then provoked a 14 percent decline in the cryptocurrency.
A breakout under the November swing-low could encourage further technical selling and push Stellar Lumen towards the September 2019 monthly low, around the $0.48 level.
Bulls ideally need to rally the cryptocurrency toward the $0.66 level in order to stabilize the XLM/USD pair. This would require a rally of over 20 percent from current levels.
Failure to break under the November swing-low, around the $0.51 support level could cause a strong buying reaction amongst medium-term XLM/USD bulls.
The Relative Strength Index on the daily time frame shows that Stellar Lumen is oversold, while the MACD indicator is still bearish.
According to the latest sentiment data from The TIE, the short-term sentiment towards Stellar Lumen is neutral at 64 percent, while the overall long-term sentiment towards the cryptocurrency is bearish at 23 percent.

Upside Potential
The four-hour time frame shows that key technical resistance is now located at the $0.66 and $0.69 levels.
Key technical resistance over the medium-term is located at the $0.80 and $0.85 levels.

Downside Potential
The four-hour time frame is showing that the XRP/USD pair has strong medium-term technical support around the $0.51 and $0.47 levels. Critical long-term technical support for XRP is located at the $0.40 support level.
Summary
Stellar Lumen is yet another major cryptocurrency that has failed to rally and shake-off bearish medium-term pressure. The XLM/USD pair needs to rally from current level, or it could slump back towards the September 2019 monthly price low.
