
Shutterstock cover by Yongkiet Jitwattanatam
Terra’s LUNA in Overbought Territory After 180% Rally
Terra’s LUNA token has outperformed the top three cryptocurrencies by market cap after enjoying an impressive 180% rally in the past three weeks, but it may soon face a dip.
Terra’s native token, LUNA, has stolen the crypto spotlight after gaining over 10 points in market value within 17 days. Now, the technicals forecast that a spike in profit-taking is imminent.
Terra Primed to Retrace
Terra could be due for a correction.
LUNA has lived up to its name as it has been mooning over the last three weeks. The twenty-third-largest cryptocurrency by market cap has surged by nearly 180% since Jul. 20, going from a low of $5.60 to a high of $15.50.
Although Terra may have room for another leg up, it is currently trading in overbought territory. The Relative Strength Index or RSI is hovering at a value of 82.20 on the daily chart, which is something to be concerned about.
Every time LUNA’s daily RSI has moved past the 80 mark since mid-February 2020, a steep correction followed.
The Tom DeMark (TD) Sequential indicator adds credence to the bearish thesis. This technical index is about to present a sell signal in the form of green nine candlesticks within the same time frame.
Although the bearish formation is yet to form, the near-term future does not look good for the bulls.
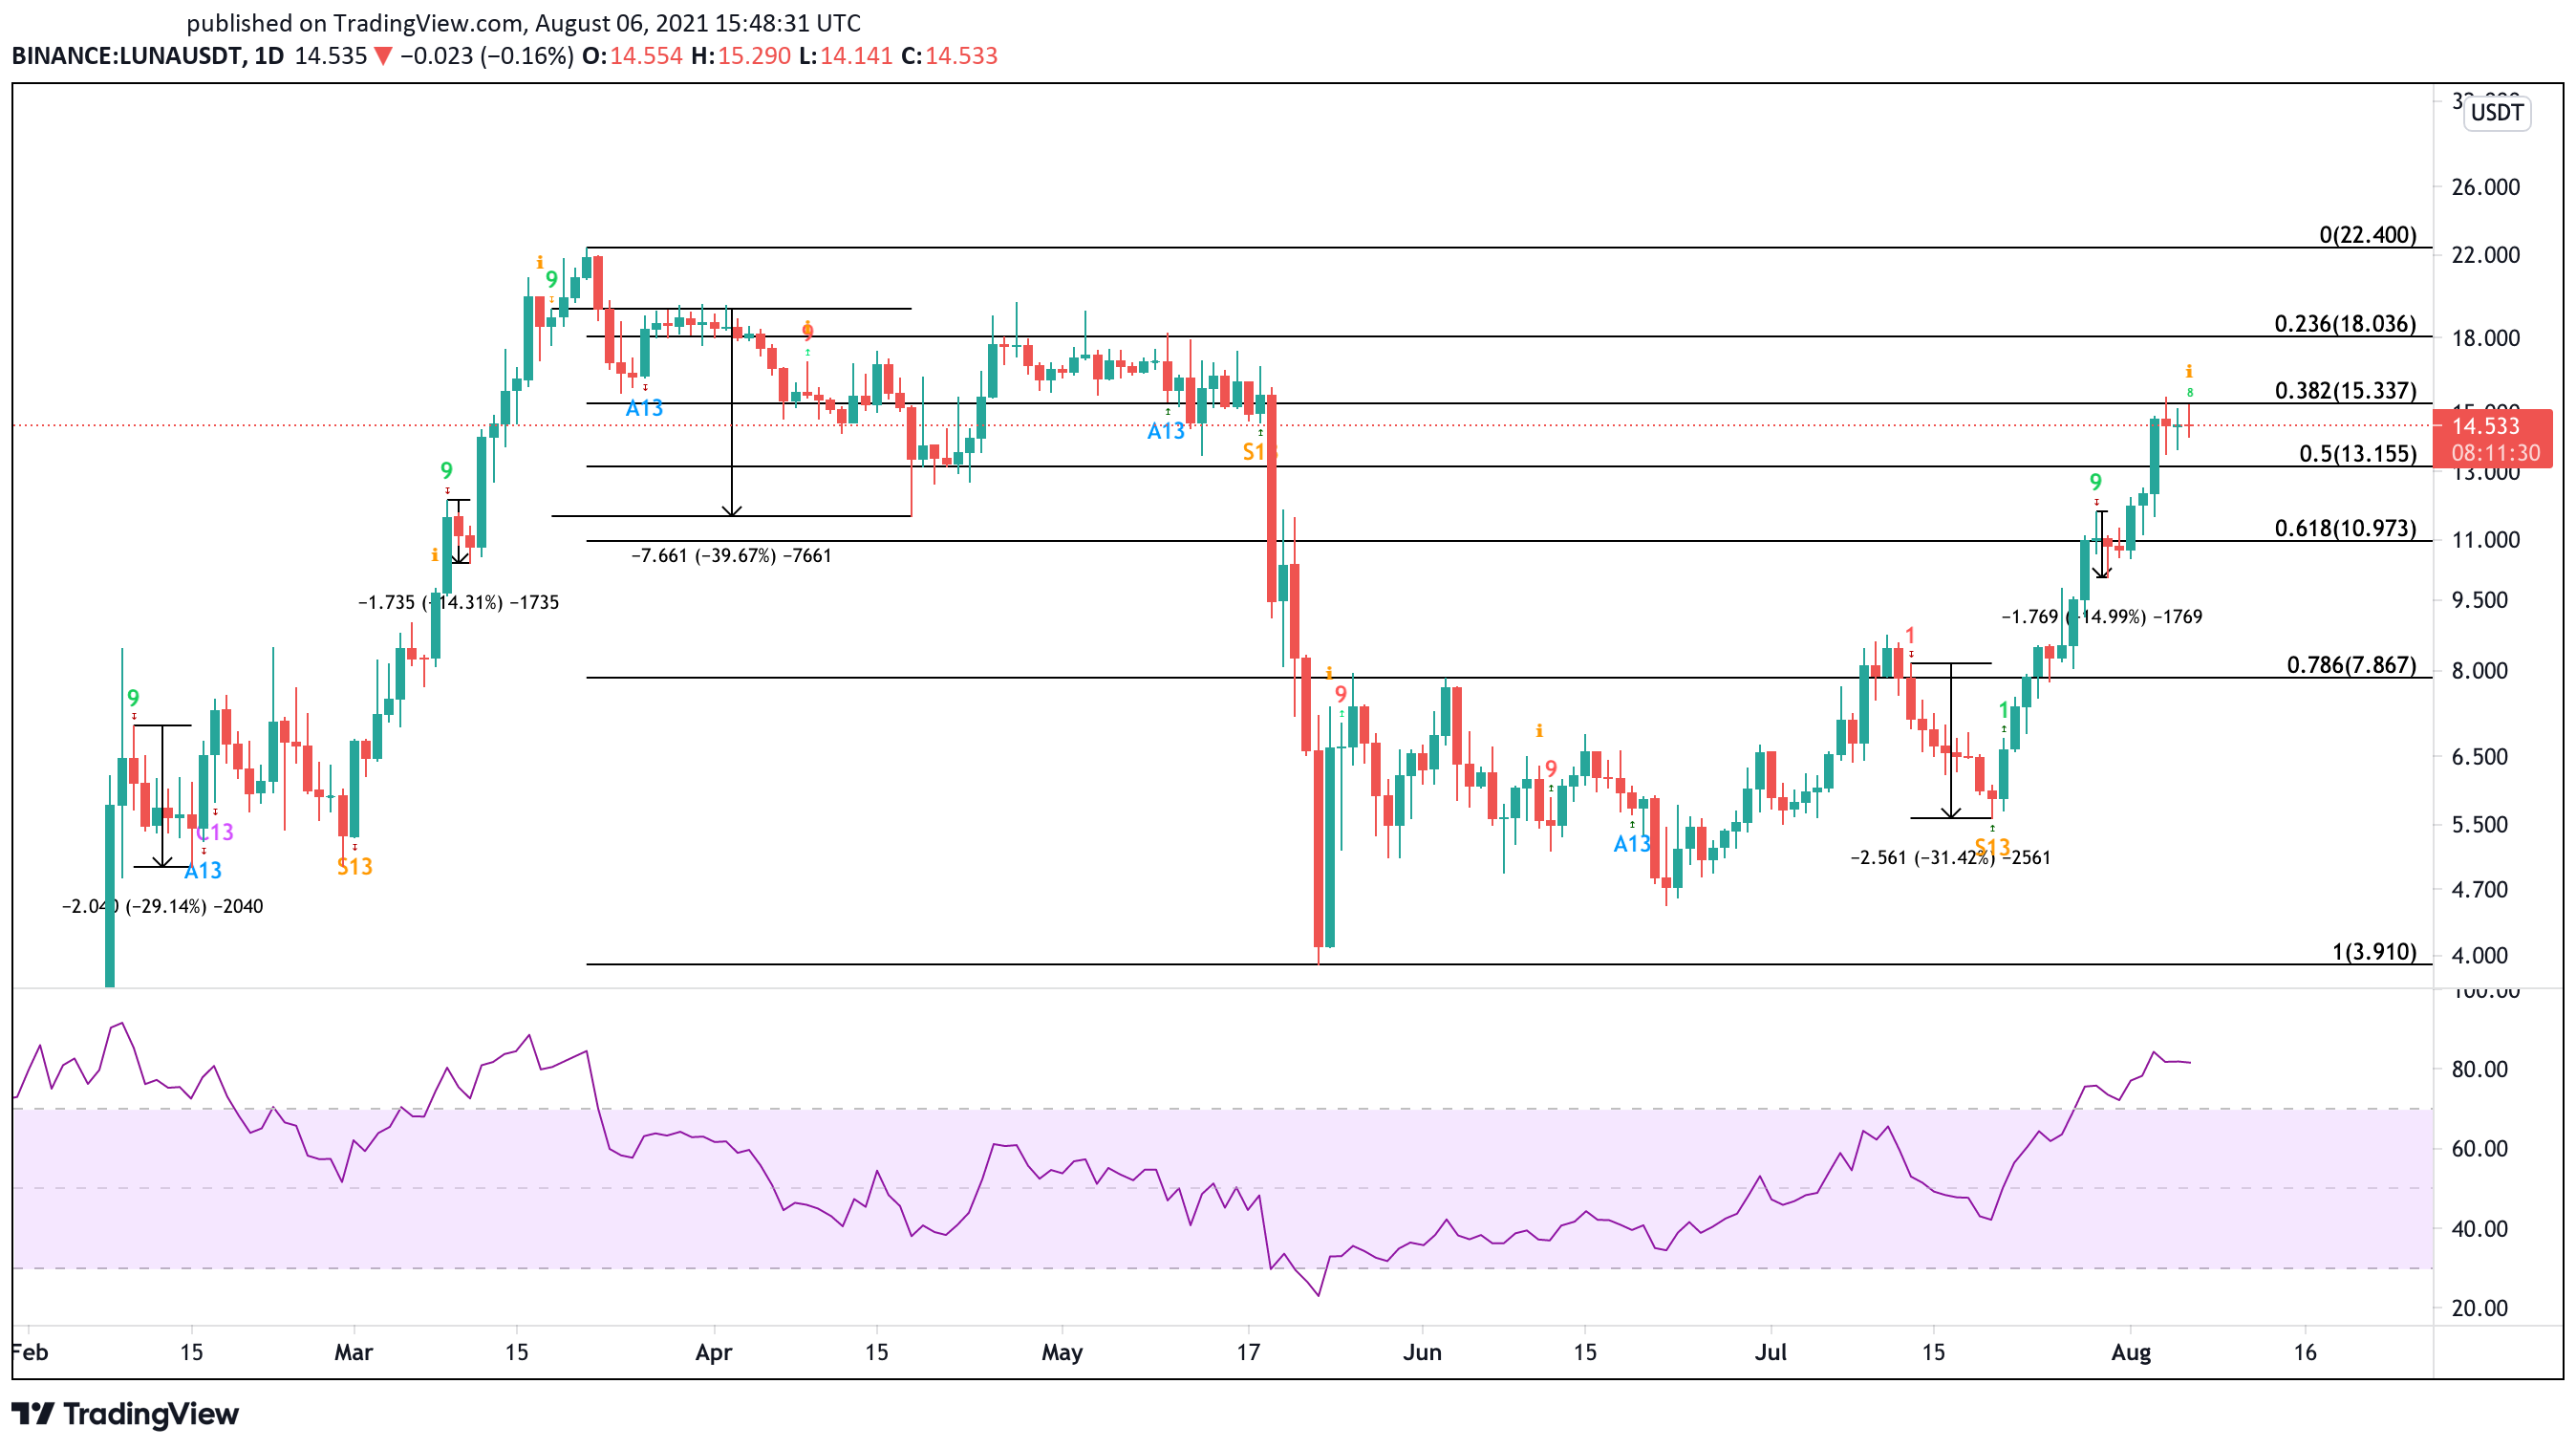
A glimpse at Terra’s daily chart reveals that the TD setup has been incredibly accurate at anticipating local tops on LUNA’s trend. The five sell signals that this indicator has presented since the beginning of the year were all validated, resulting in significant retracements.
Therefore, the pessimistic scenario must be considered despite the significant buying pressure seen behind LUNA.
The Fibonacci retracement indicator (measured from the March 21 high of $22.40 to the May 23 low of $3.90) suggests that a spike in profit-taking around the current price levels could see Terra dive towards $11.00. Failing to hold around this crucial support level may lead to a steeper correction to $7.90.
It is worth noting that as the TD’s sell signal has not been formed yet, LUNA may advance further before the retracement materializes. A clear break of the 38.20% Fibonacci retracement level at $15.30 would signal a partial continuation of the uptrend to the 23.60% Fibonacci retracement level at $18.00.