Tezos, Chainlink Take Nosedive as Market Retraces
Both XTZ and LINK saw market-beating gains during this year's rally. Both were also hit the hardest by the recent correction

Share this article
Tezos and Chainlink are some of the biggest losers in the recent cryptocurrency market downturn. Are they bound for a steeper decline?
Tezos Signals Further Correction
From a long-term perspective, the parabolic stop and reverse, or “SAR,” has just presented a sell signal on XTZ’s 3-day chart. Every time the stop and reversal points move above the price of an asset, it is considered to be a negative sign.
This bearish formation indicates that the direction of the trend for Tezos changed from bullish to bearish.
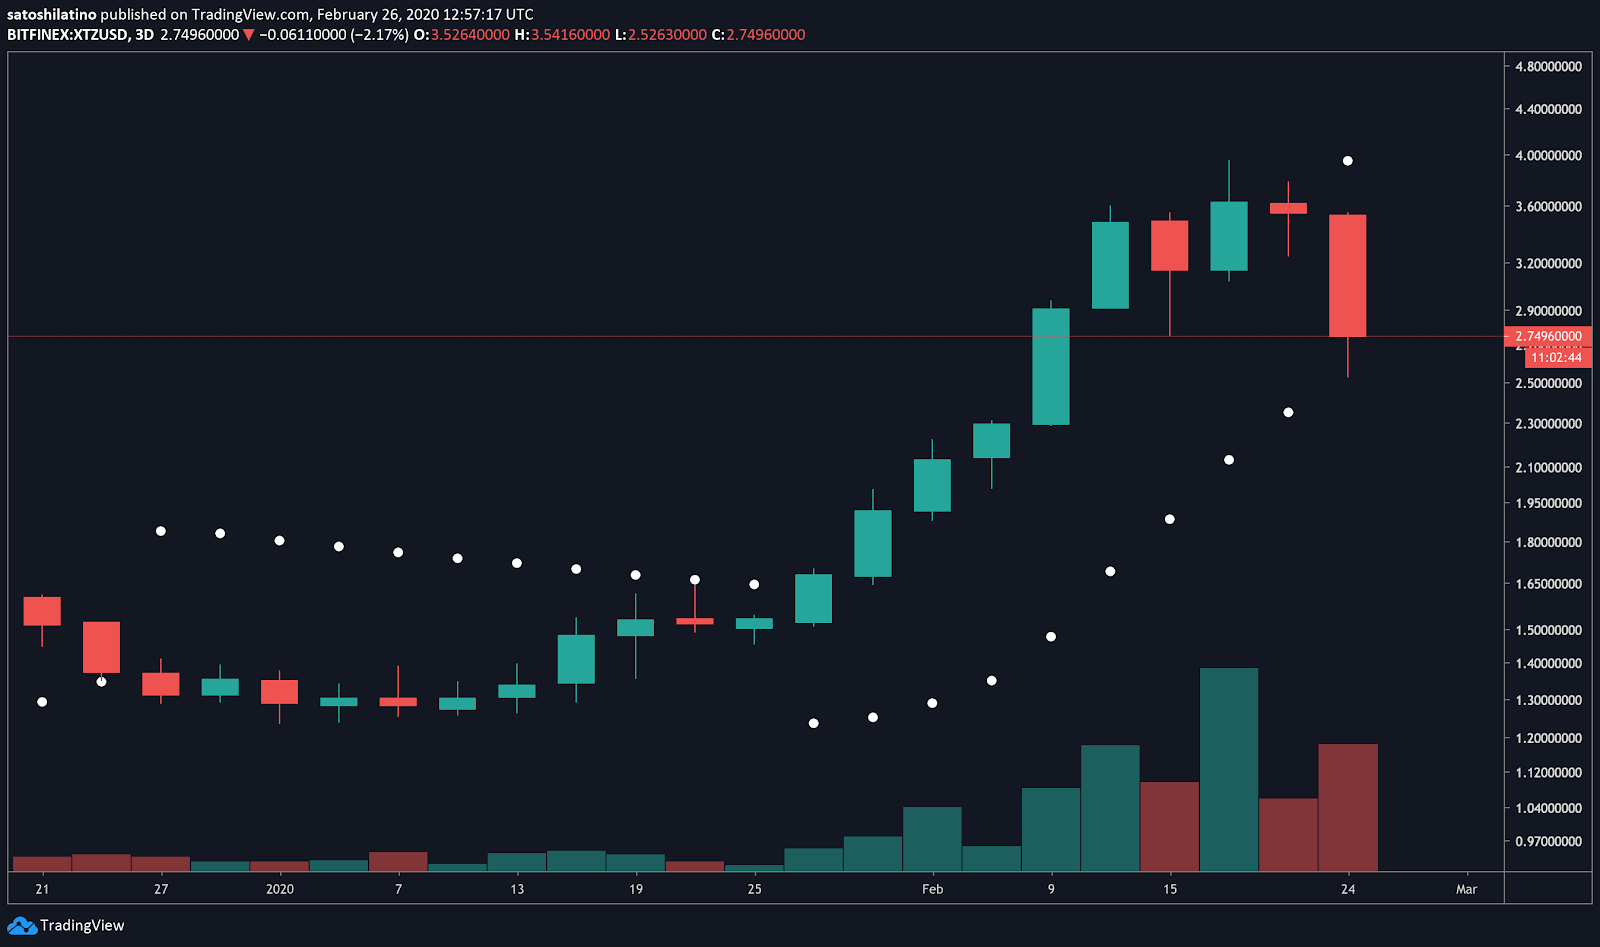
Based on historical data, the stop and reversal system appears to be highly effective in determining the direction of XTZ’s trend.
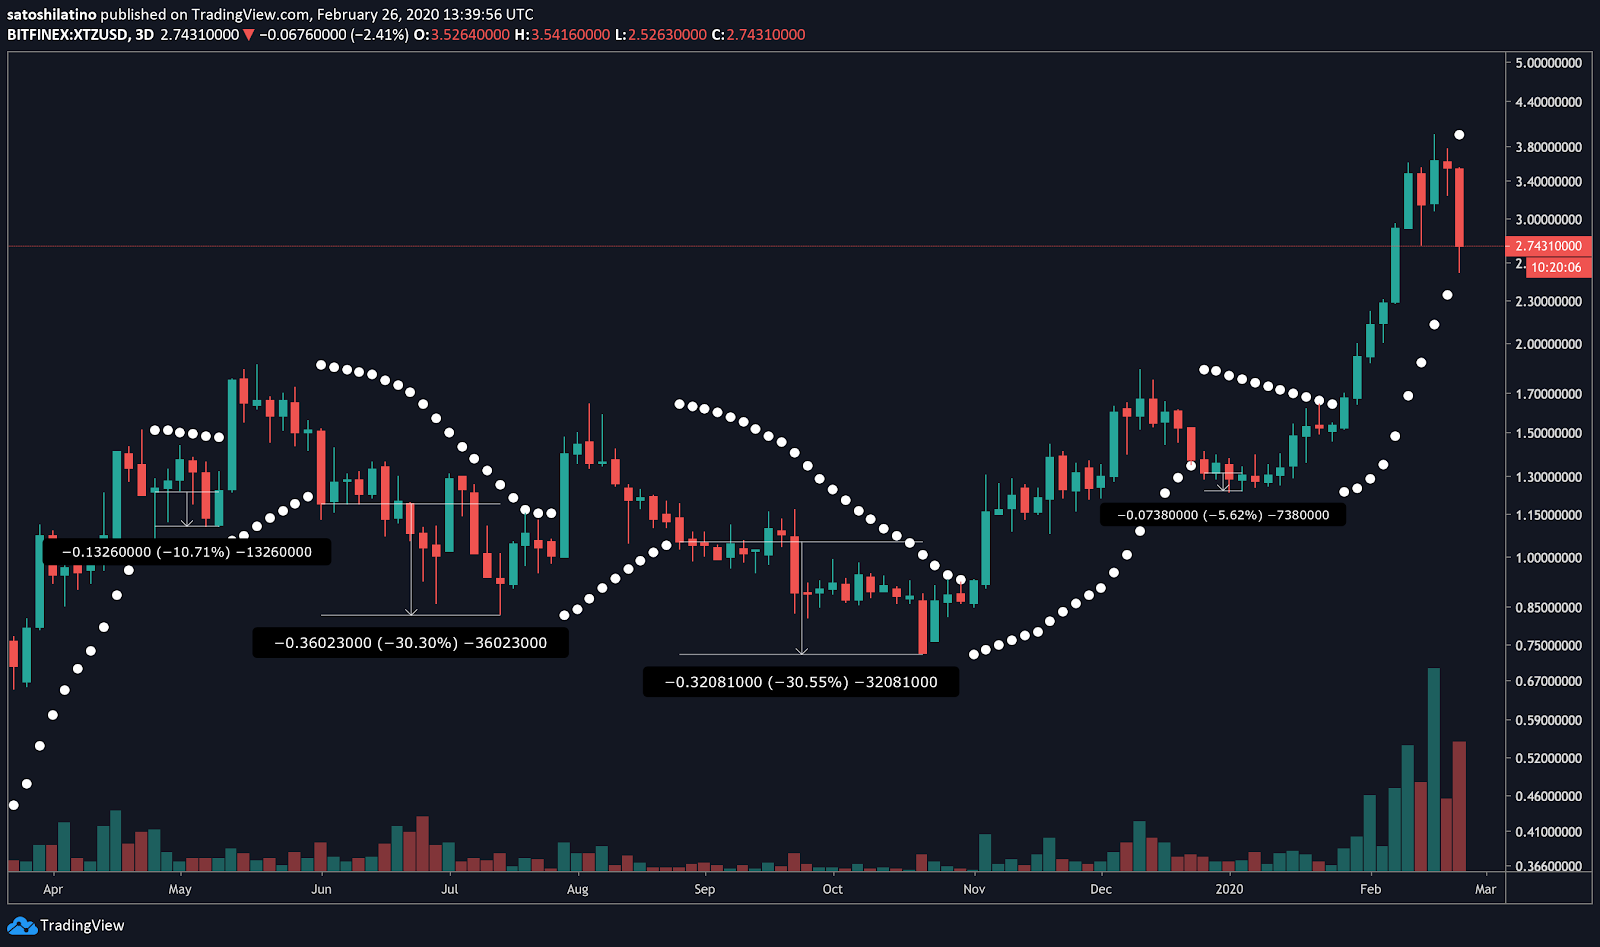
In fact, the last four times the parabolic SAR flipped from bullish to bearish within the 3-day chart Tezos plummeted 11%, 30%, 30.6%, and 5.6%, respectively. These percentages only include the losses from the next candlestick close after the bearish formation developed.
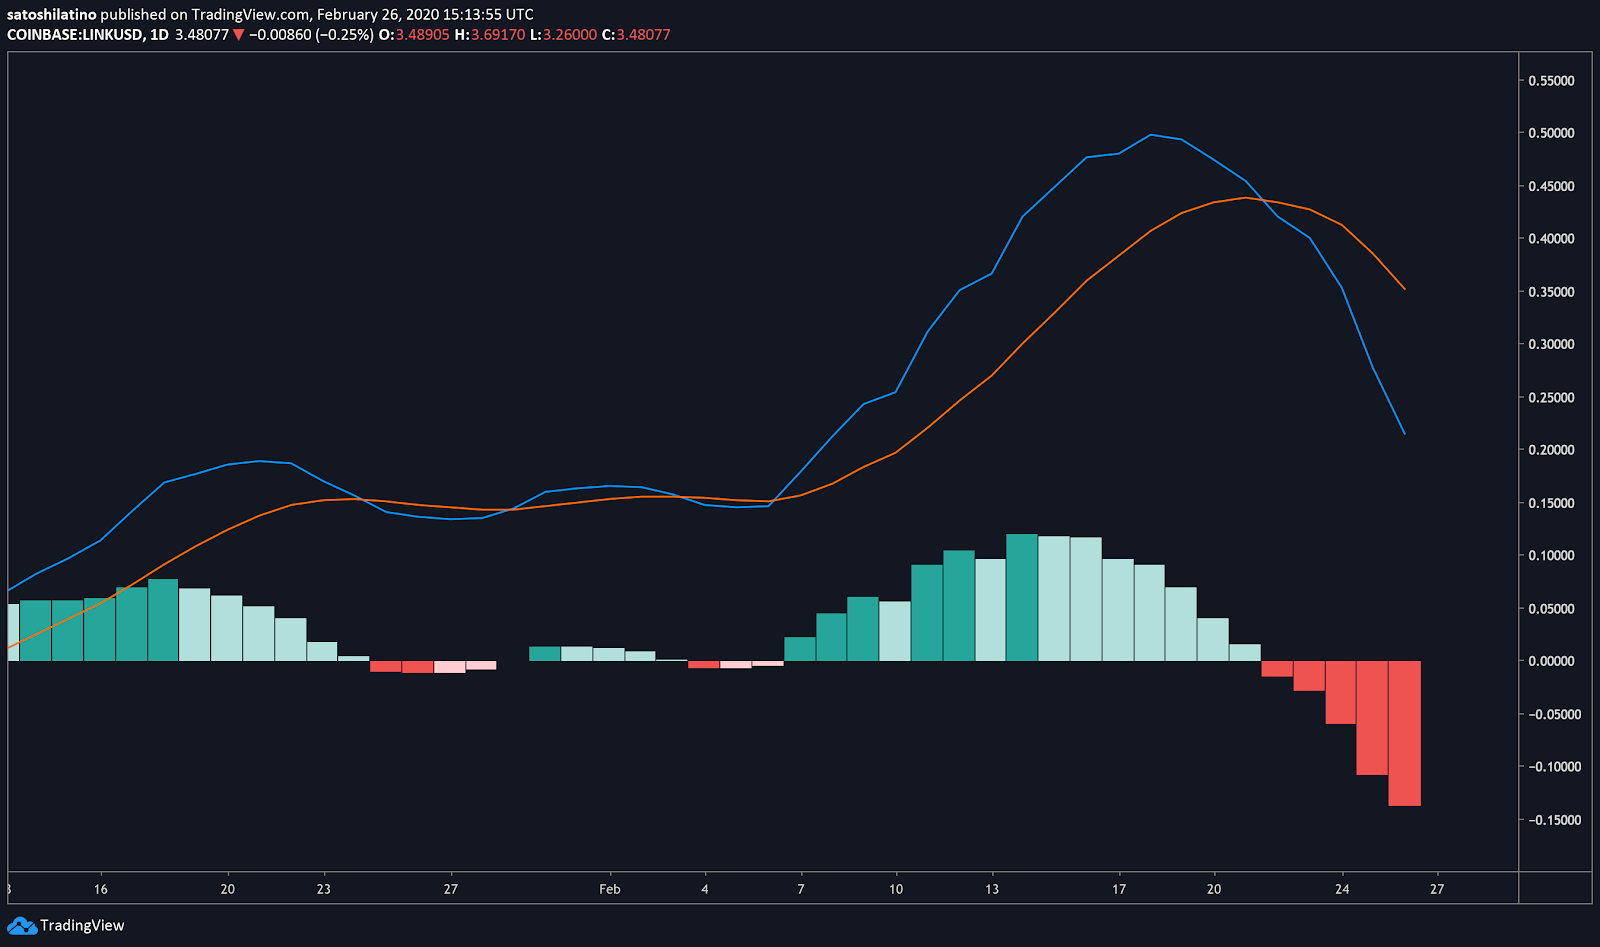
The moving average convergence divergence, or MACD, also turned bearish recently within the 1-day chart. This technical indicator follows the path of a trend and calculates its momentum.
As the 12-day exponential moving average moved below the 26-day exponential moving average, the odds for a further decline increased.
Now, Michaël van de Poppe, a full time trader based in Amsterdam, argues that Tezos is retracing “fairly quickly.” A definitive close below the $2.5 support level could trigger a sell-off among market participants. If this happens, XTZ could plunge to $1.8, presenting a “massive opportunity” to get back into the market, according to the analyst.
Nevertheless, if the $2.5 support level is able to hold and Tezos bounces back above $4, van de Poppe estimates a further advance to $6 or $7.
Chainlink Could Be About to Rebound
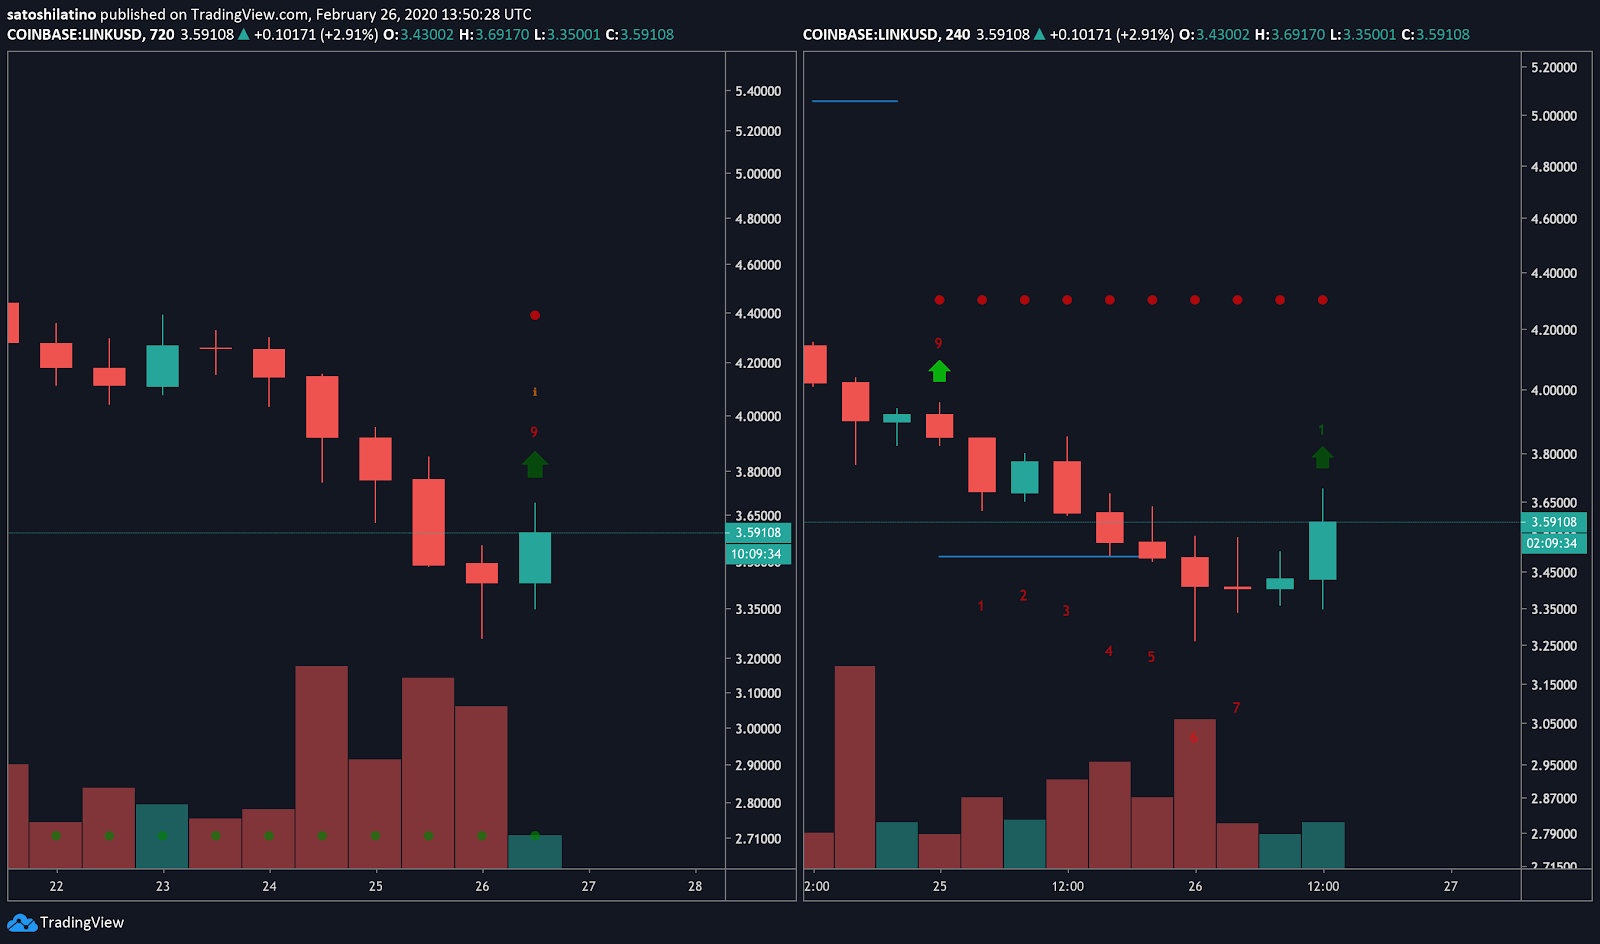
Despite the significant losses that Chainlink has posted over the past week, the TD sequential indicator forecasts that an upswing could be underway. This technical index is presenting a buy signal on both the 12-hour and the 4-hour chart in the form of a green nine candlestick.
The bullish formation predicts an upswing that could last one to four candlesticks before the continuation of the bearish trend. A green two candlestick trading above a preceding green one candle could serve as confirmation of the bullish signal.
Closing above the 38.2% Fibonacci retracement level could also add credence to the bullish outlook. Breaking this resistance barrier could be followed by a spike in volume, allowing Chainlink to bounce back to the 23.6% Fibonacci retracement level.
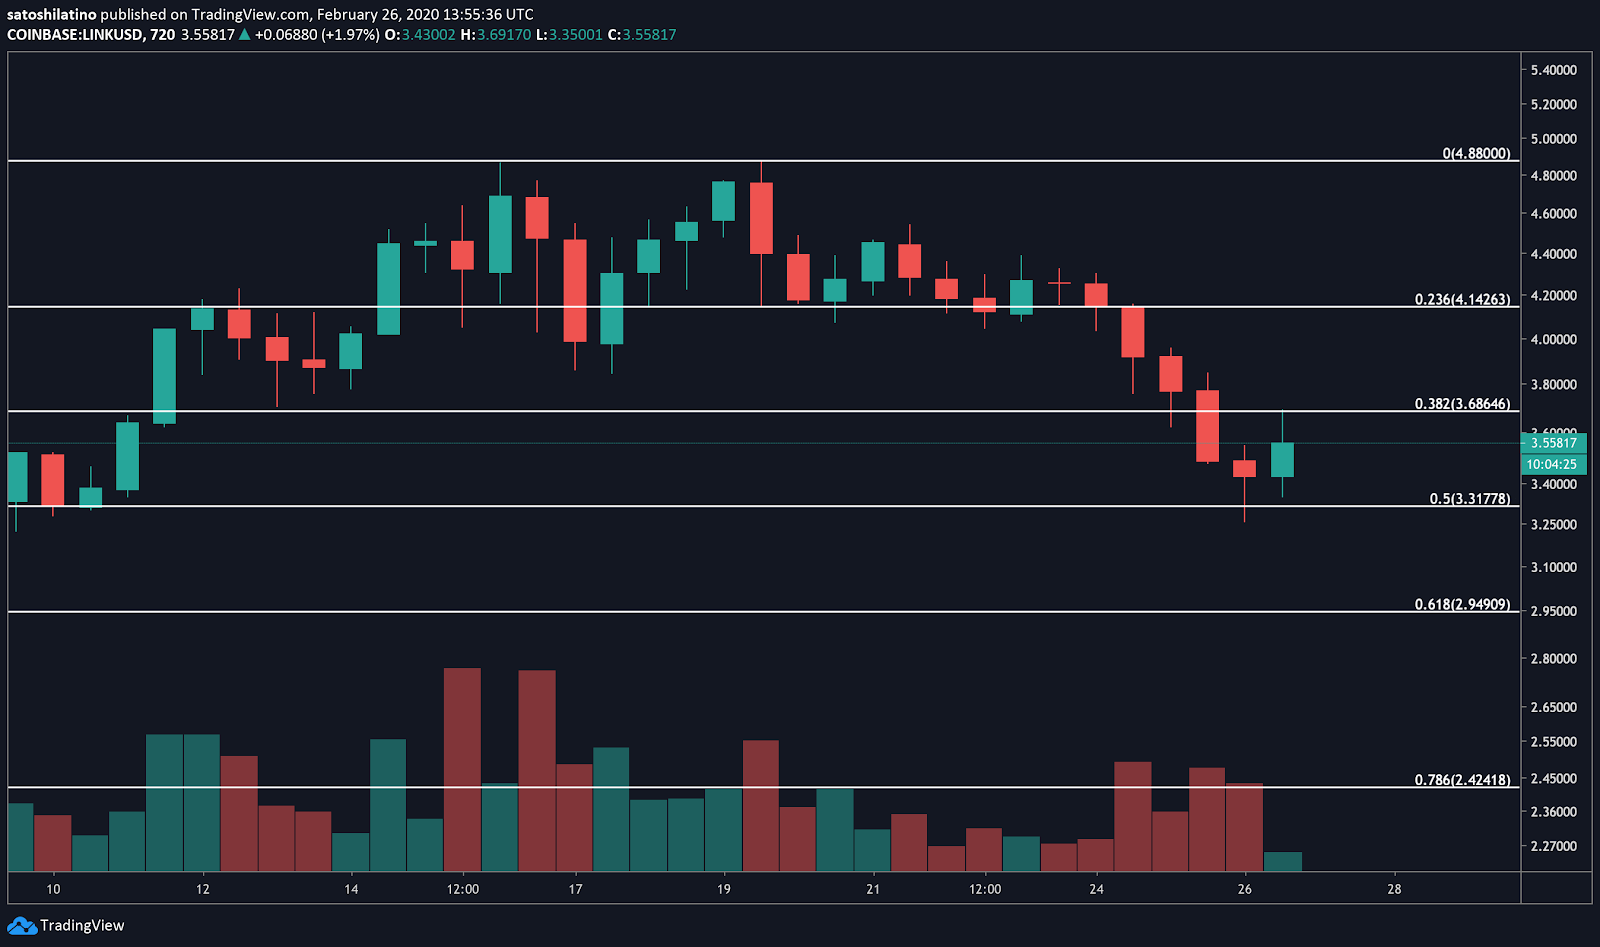
It is worth noting that the downtrend would likely resume if Tezos moves below the 50% Fibonacci retracement level, which is currently serving as an area of strong support.
The bearish impulse could cause panic among investors, sending XTZ to the 61.8% or 78.6% Fibonacci retracement levels. These support barriers currently sit around $2.95 and $2.42.
Everything’s Not Lost
Tezos and Chainlink were two of the cryptocurrencies that benefited the most from the bull rally seen across the entire industry since the beginning of the year. While XTZ skyrocketed by nearly 220%, LINK surged over 187%.
On Feb. 19, however, both of these digital assets seem to have peaked. After reaching an exhaustion point their prices plummeted over 30%. The significant bearish impulse allowed Tezos and Chainlink to hit their respective 50% Fibonacci retracement levels.
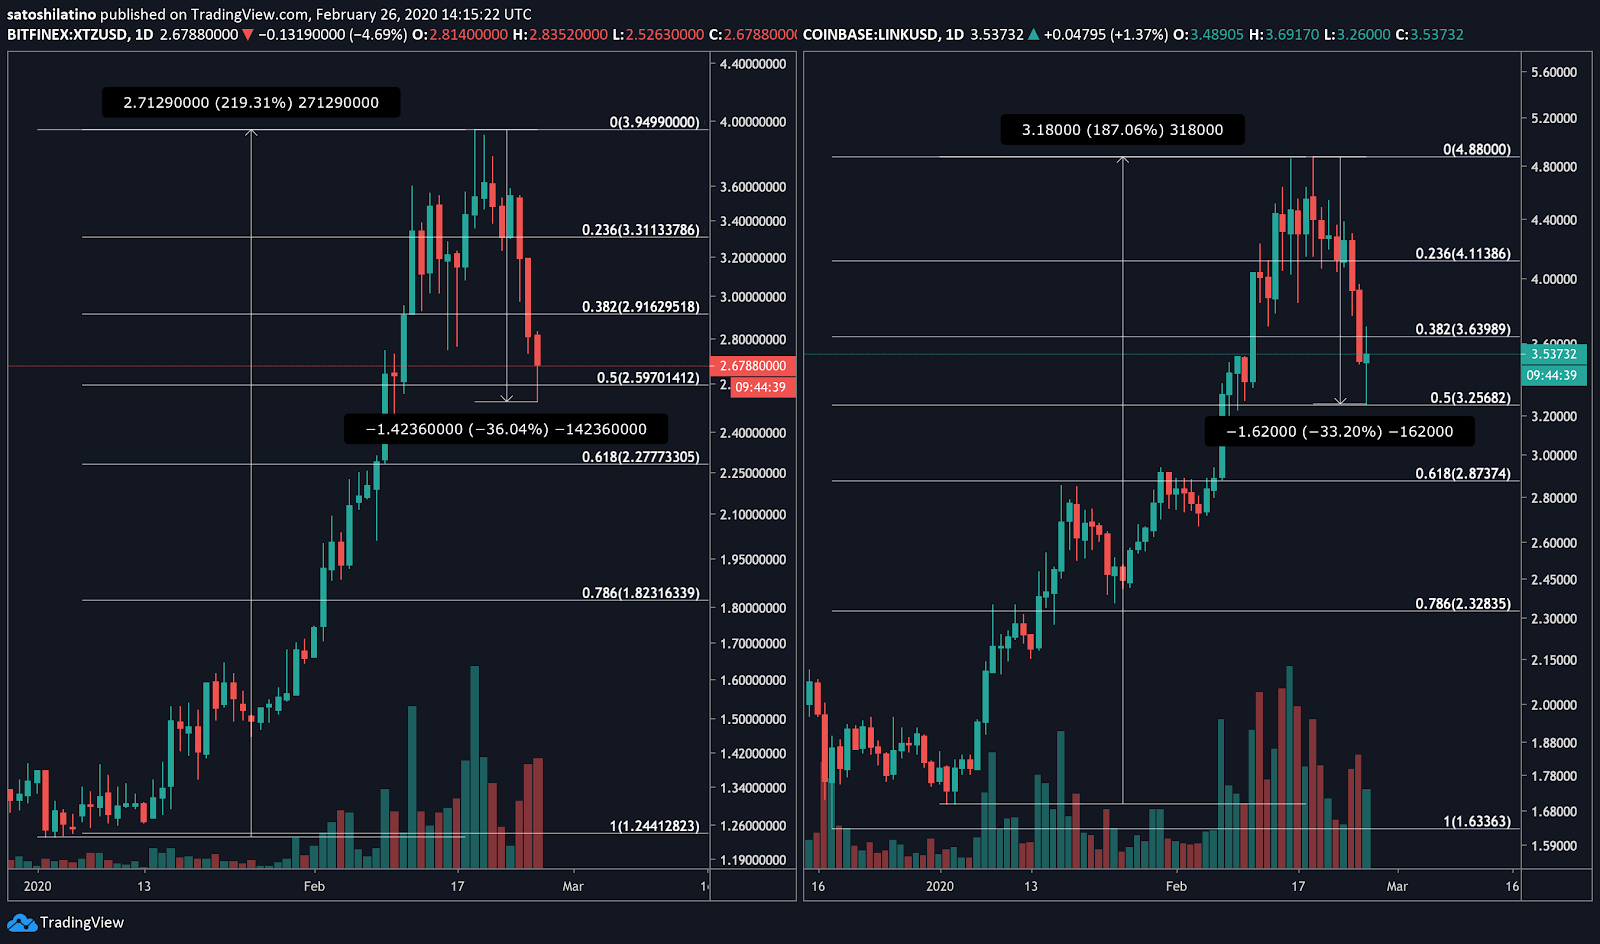
Based on Gann’s 50% retracement theory, the current price levels could present an opportunity to “buy the dip.” If the uptrend resumes, both XTZ and LINK could surge and surpass recent yearly highs.
However, investors must be cautious since this area also represents a danger zone. Failing to hold could trigger a full-fledged bullish to bearish reversal.
Overall Market Sentiment
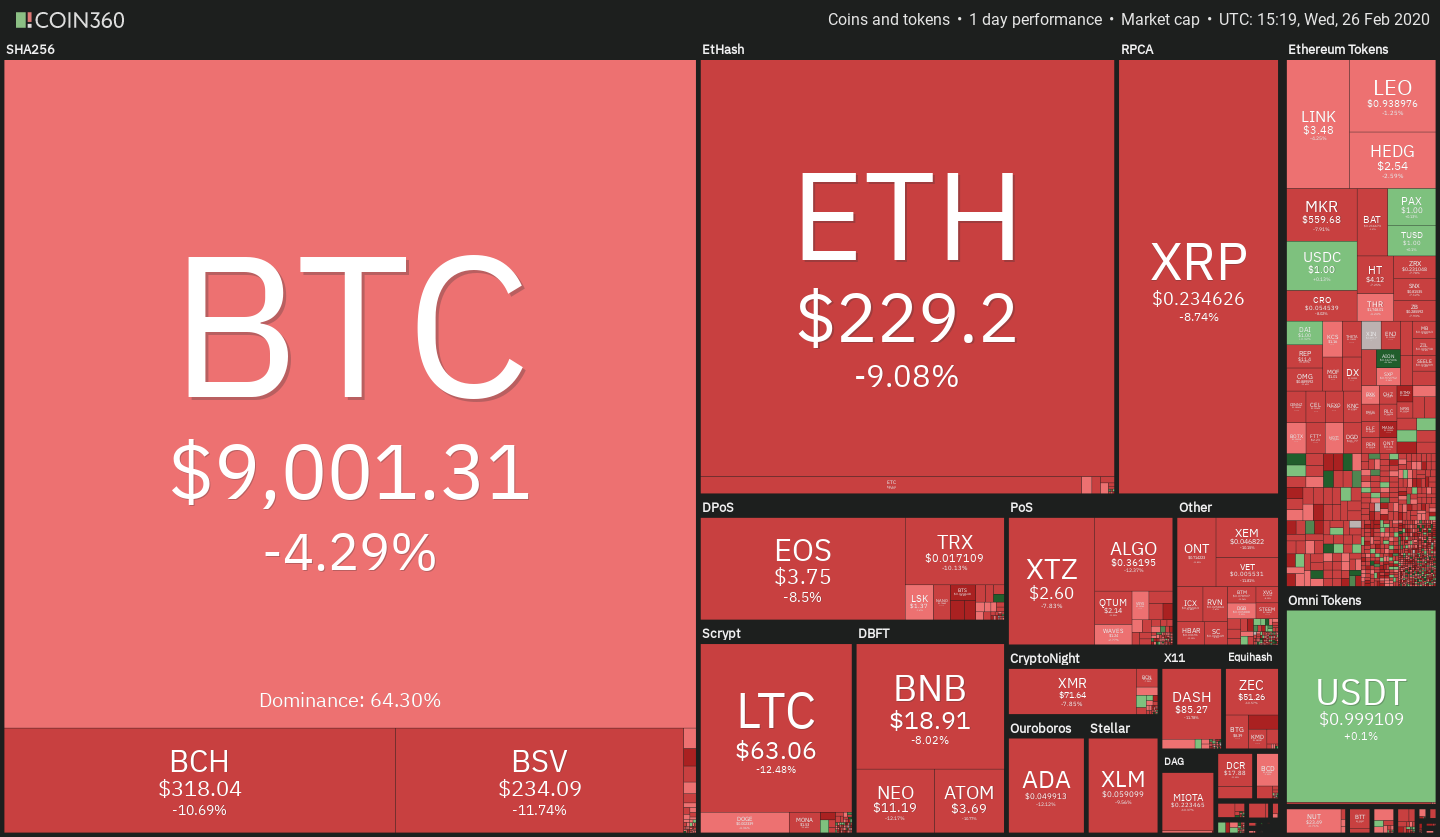
Over $60 billion has been wiped out of the cryptocurrency markets since Feb. 13. A glimpse at Coin360’s crypto map reveals that the downturn is market-wide and includes Tezos and Chainlink.
The “fairly quickly” retracement, as van de Poppe described it, appears to have caused a state of fear among market participants, according to the Crypto Fear and Greed Index (CFGI). This fundamental indicator has been sensing high levels of fear in the cryptocurrency market since last week reaching a value as low as 41 (fear).
The last time the CFGI was this low was on Jan. 24 when it hit a value of 40. Fear can be perceived as a positive sign, however, having in mind that the wisdom of the crowd is usually wrong.
While crypto derivatives exchange BitMEX recorded around $83 million worth of long liquidations today as Bitcoin dipped below $9,000, the current correction could present an opportunity for sidelined investors to get back into the market. A fresh inflow of capital would likely allow the market to bounce back to new highs.
This scenario aligns with Rekt Capital’s hypothesis that prior to the Bitcoin’s halvings the entire market tends to retrace significantly. Before the 2016 block rewards reduction event, for instance, the total crypto market capitalization dropped over 30%. A similar phenomenon occurred prior to the 2012 halving.
Although there are not any outstanding commonalities among these retraces, it is possible that the current correction would lead to new all time highs like it happened in the past, according to Rekt Capital.
Share this article
