
Shutterstock cover by Inked Pixels/Mariia Kozyr
These Metrics Could Help Time the Bitcoin Market Bottom
On-chain metrics can help anticipate whether Bitcoin is close to reaching a market bottom.
Bitcoin is locked in a steep downtrend that has seen it retrace by more than 63% over the past seven months. Still, on-chain metrics suggest that the top cryptocurrency has further to fall before it hits a market bottom.
Anticipating the Market Bottom
Bitcoin appears to have found temporary support around the psychological $30,000 level, but another downswing is still in the cards.
The flagship cryptocurrency has lost more than 43,600 points in market value over the past seven months. It went from hitting an all-time high of nearly $69,000 in early November 2021 to recently sweeping a multi-year low of $25,365. Even though the losses have been significant, it’s possible Bitcoin’s steep downtrend has not reached exhaustion yet.
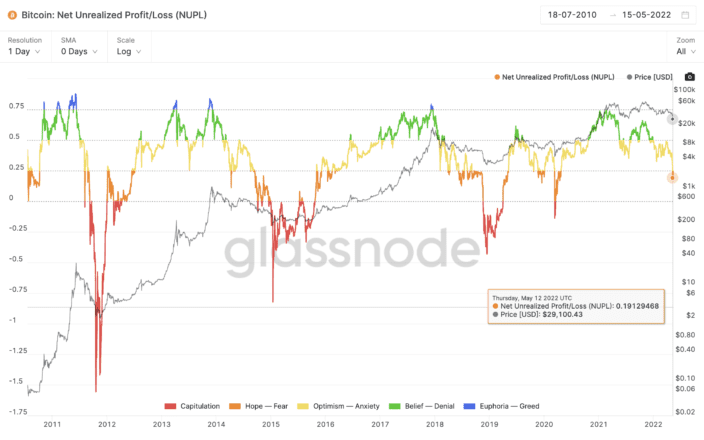
The Net Unrealised Profit/Loss (NUPL) indicator can help anticipate shifts in market sentiment and predict market tops and bottoms on Bitcoin’s trend. It relies on multiple on-chain data points to demonstrate potential investors’ emotions at a given time, which helps in determining price movements.
The market sentiment around Bitcoin appears to have shifted from Anxiety to Fear after prices dropped below $30,000. Still, the NUPL suggests that investors’ emotions have to drop from Anxiety to Capitulation to mark the end of the downtrend.
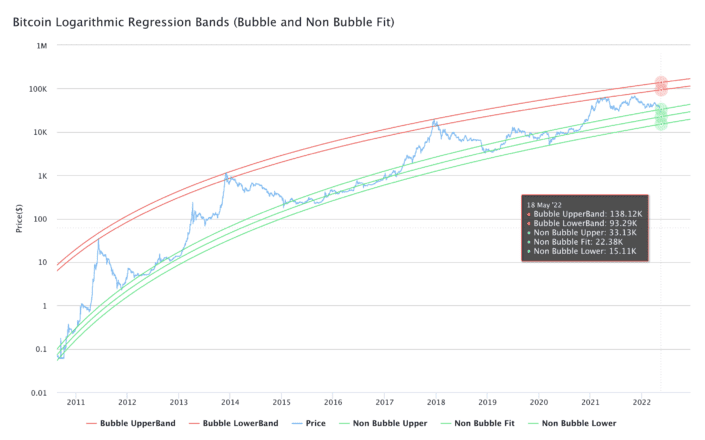
Logarithmic regression lines by highlighted by crypto YouTuber Benjamin Cowen define two key price levels where Bitcoin could bottom out. The non-bubble fit regression band sits at $22,380, while the non-bubble lower regression band hovers around $15,110. A downswing to these price points could see the NUPL shift to Capitulation, presenting a unique opportunity for sidelined investors to re-enter the market.
It remains to be seen whether the combination of NUPL and the logarithmic regression lines will help anticipate a market bottom as these indicators have done in the past. It is also worth noting that after the significant correction that Bitcoin has seen over the past few months, there is a chance for it to enter a consolidation period before its next significant price movement.
Disclosure: At the time of writing, the author of this piece owned BTC and ETH.