Theta Token Price Analysis THETA / USD: Bulls Peeking Out
Over time, the bulls will grow in strength...

Share this article
- THETA remains technically bearish over both the short-term and the medium-term
- The four-hour time is showing a valid bearish head and shoulders pattern
- But the daily time frame shows a huge bullish reversal pattern
THETA is on the rise in early week trading, as the increasingly popular cryptocurrency attempts to stage a bullish breakout above its key short-term moving averages.
The THETA / USD pair is now showing signs of price stabilization after coming under intense selling pressure over the summer. THETA has so far recovered close to thirteen percent in value from the worst levels of September and trades close to five percent in the green for October.
At current trading levels, the THETA / USD pair has gained close to seventy percent since the start of the year, although it trades around fifty eight percent lower from its 2019 trading high.
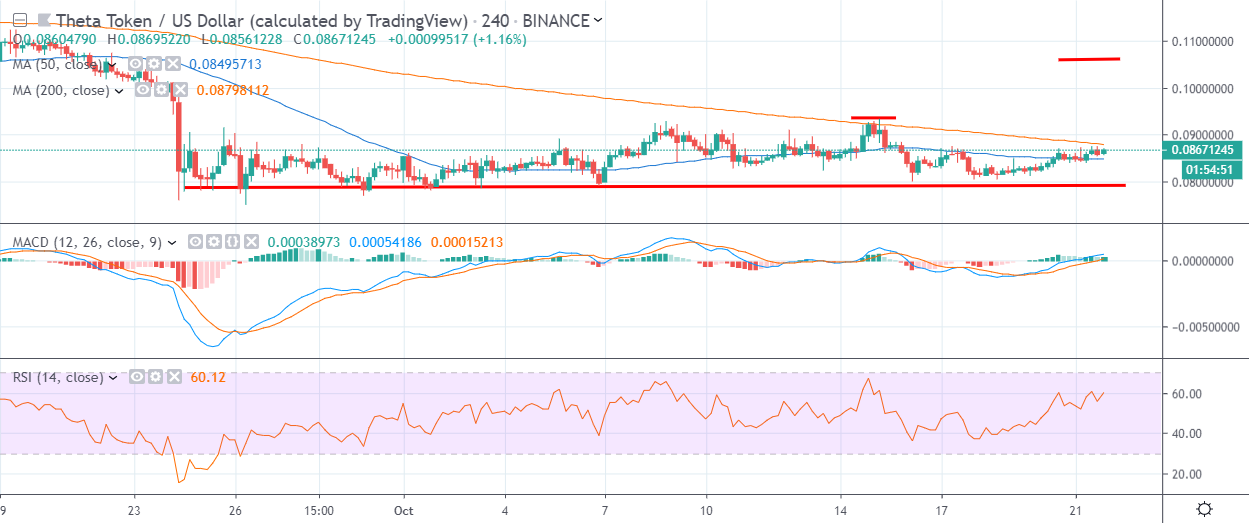
From a technical perspective, the cryptocurrency is still bearish across the short and medium-term horizon. Short-term bulls are, however, close to moving price above the THETA / USD pair’s 200-period moving average for the first time since late-August.
The lower time frames are currently showing that a bearish head and shoulders pattern has formed, with the bearish pattern holding a downside projection of around $0.014000.
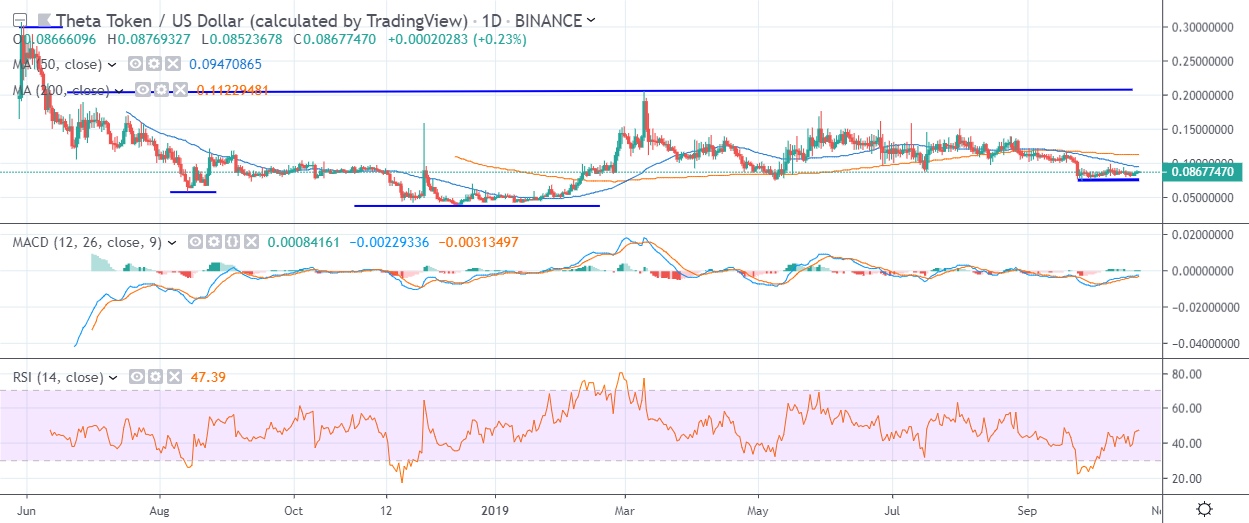
If the pattern was invalidated, the bullish target would take the THETA / USD back towards its 200-day moving average. It is worth noting that a rally of around sixty percent would need to occur for this to happen.
It is also noteworthy that the daily time frame highlights that a valid inverted head and shoulders pattern has formed on the daily time frame. Bulls would need to rally the THETA / USD pair by around one hundred and thirty percent to trigger the bullish pattern into action.
Sentiment
According to the latest sentiment data from TheTIE.io, the short-term sentiment towards THETA is bearish, at 39.50 %, while the overall long-term sentiment towards the cryptocurrency is neutral, at 53.50%.
Upside Potential
The four-hour time frame highlights that bulls need to move price above the $0.093500 level to invalidate the bearish head and shoulders pattern. The THETA / USD pair’s 200-period moving average on the mentioned time frame offers the strongest form of near-term resistance, around the $0.087000 level.
The daily time frame shows that the $0.096000 and the $0.115000 levels offers the strongest form of medium-term resistance.
Downside Potential
The four-hour time frame is currently showing that a bearish head and shoulders pattern has formed, with the $0.079000 level the neckline of the bearish pattern.
The daily time frame is showing that a breakout below the $0.075000 level would be extremely bearish for the THETA / USD pair.
Summary
THETA should be monitored closely over the coming sessions as the cryptocurrency is approaching a potential short-term technical shift.
A breakout above its current monthly trading high could prompt a strong double-digit recovery for THETA. Our SIMETRI Research team has covered THETA in depth.
Photo: Moose, The Official Crypto Bull.
Share this article
