 Earn with Nexo

Zilliqa Primed to Retrace Before Possible Bull Run
Zilliqa's uptrend appears to be reaching exhaustion as multiple patterns suggest upcoming correction.
Zilliqa recently rose to a new two-year high of $0.054 after breaking out of a massive consolidation pattern. The coin’s value could rise as high as $0.36 in the future.
Zilliqa Primed for 600% Gains
While ZIL could still increase in value, several technical patterns warn of a short-term correction before the uptrend resumes.
When looking at Zilliqa from a macro perspective, namely the 1-week chart, the $0.028 level has proven to be quite significant for Zilliqa’s trend. This price hurdle has served as strong resistance ever since ZIL dropped beneath it in November 2018, containing the cryptocurrency from achieving its upside potential since then.
Each time Zilliqa attempted to break through this supply barrier, a major correction followed. But on Dec. 2, the buying pressure behind the cryptocurrency was strong enough to break through the $0.028 multi-year barrier. This led to a 106% upswing.
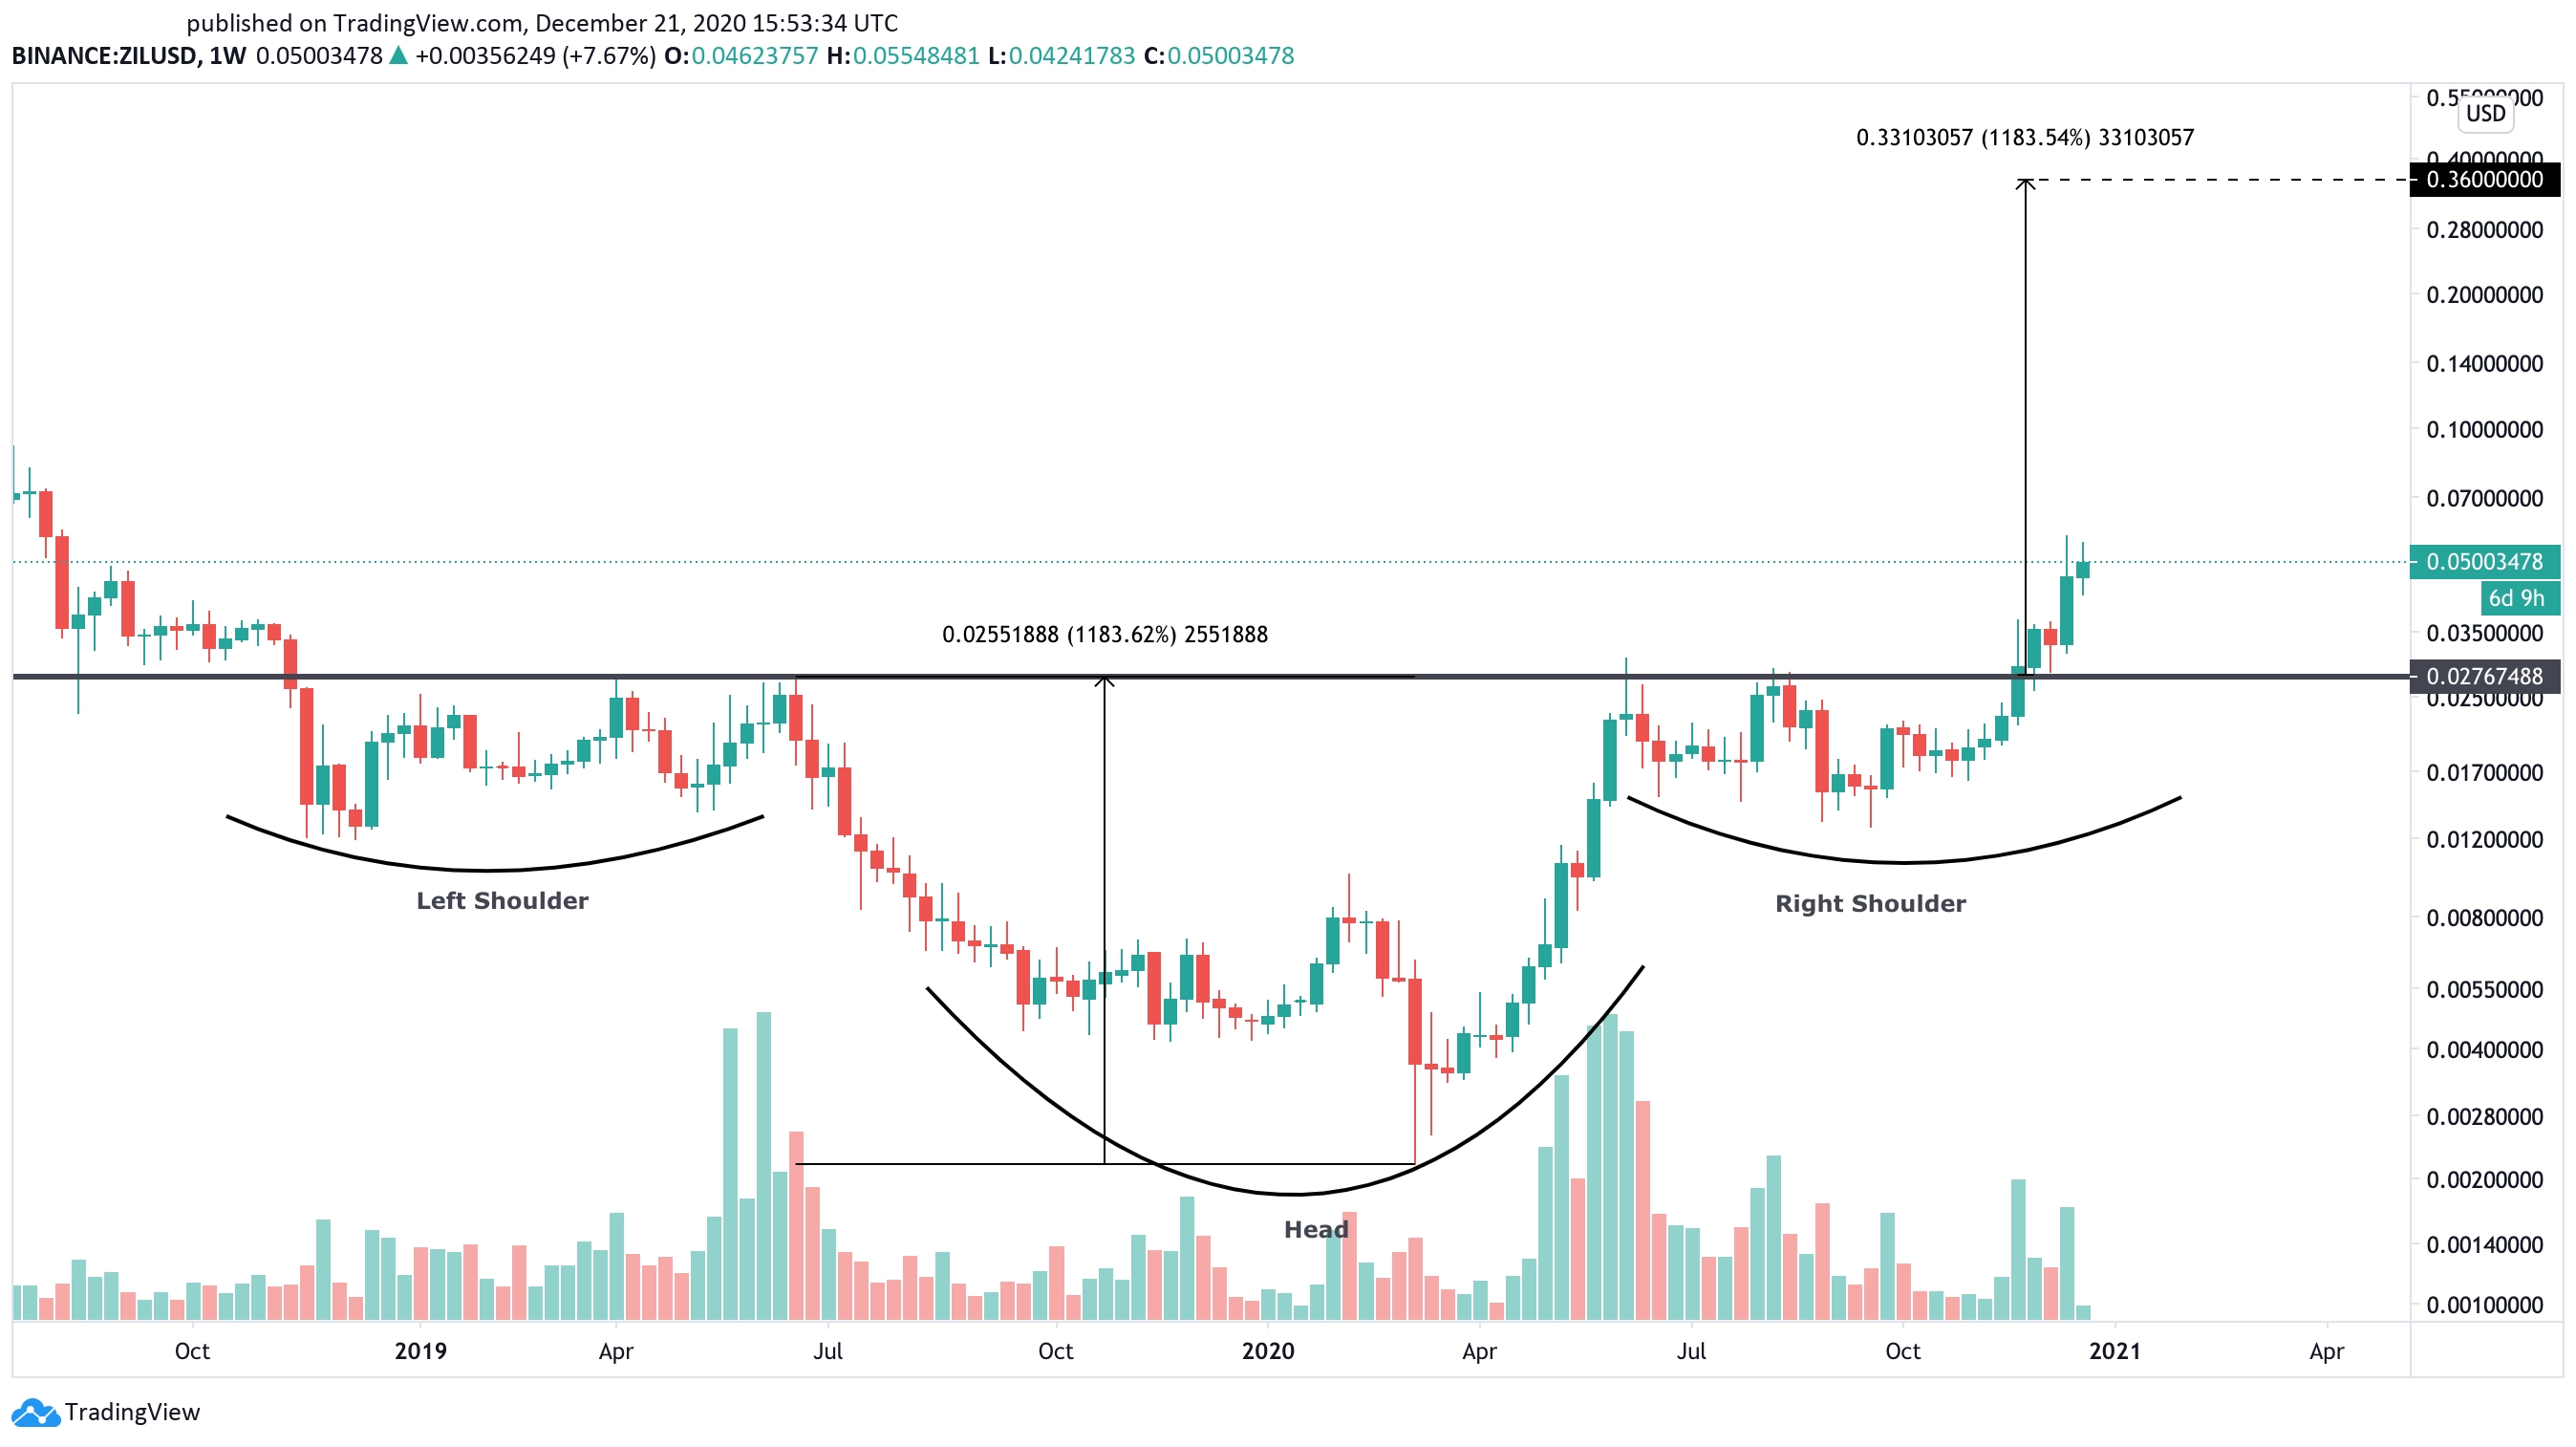
Despite the massive gains incurred in such a short period, ZIL seems primed to advance further from a long-term perspective. An inverse head-and-shoulders pattern on the weekly chart means that Zilliqa prices could rise by more than 600% to hit a target of $0.36.
This target is determined by measuring the distance between the pattern’s head and the neckline and adding it to the breakout point.
Short-Term Correction on the Horizon
In shorter time frames, such as the daily chart, Zilliqa seems to be bound for a short-lived pullback before the uptrend resumes.
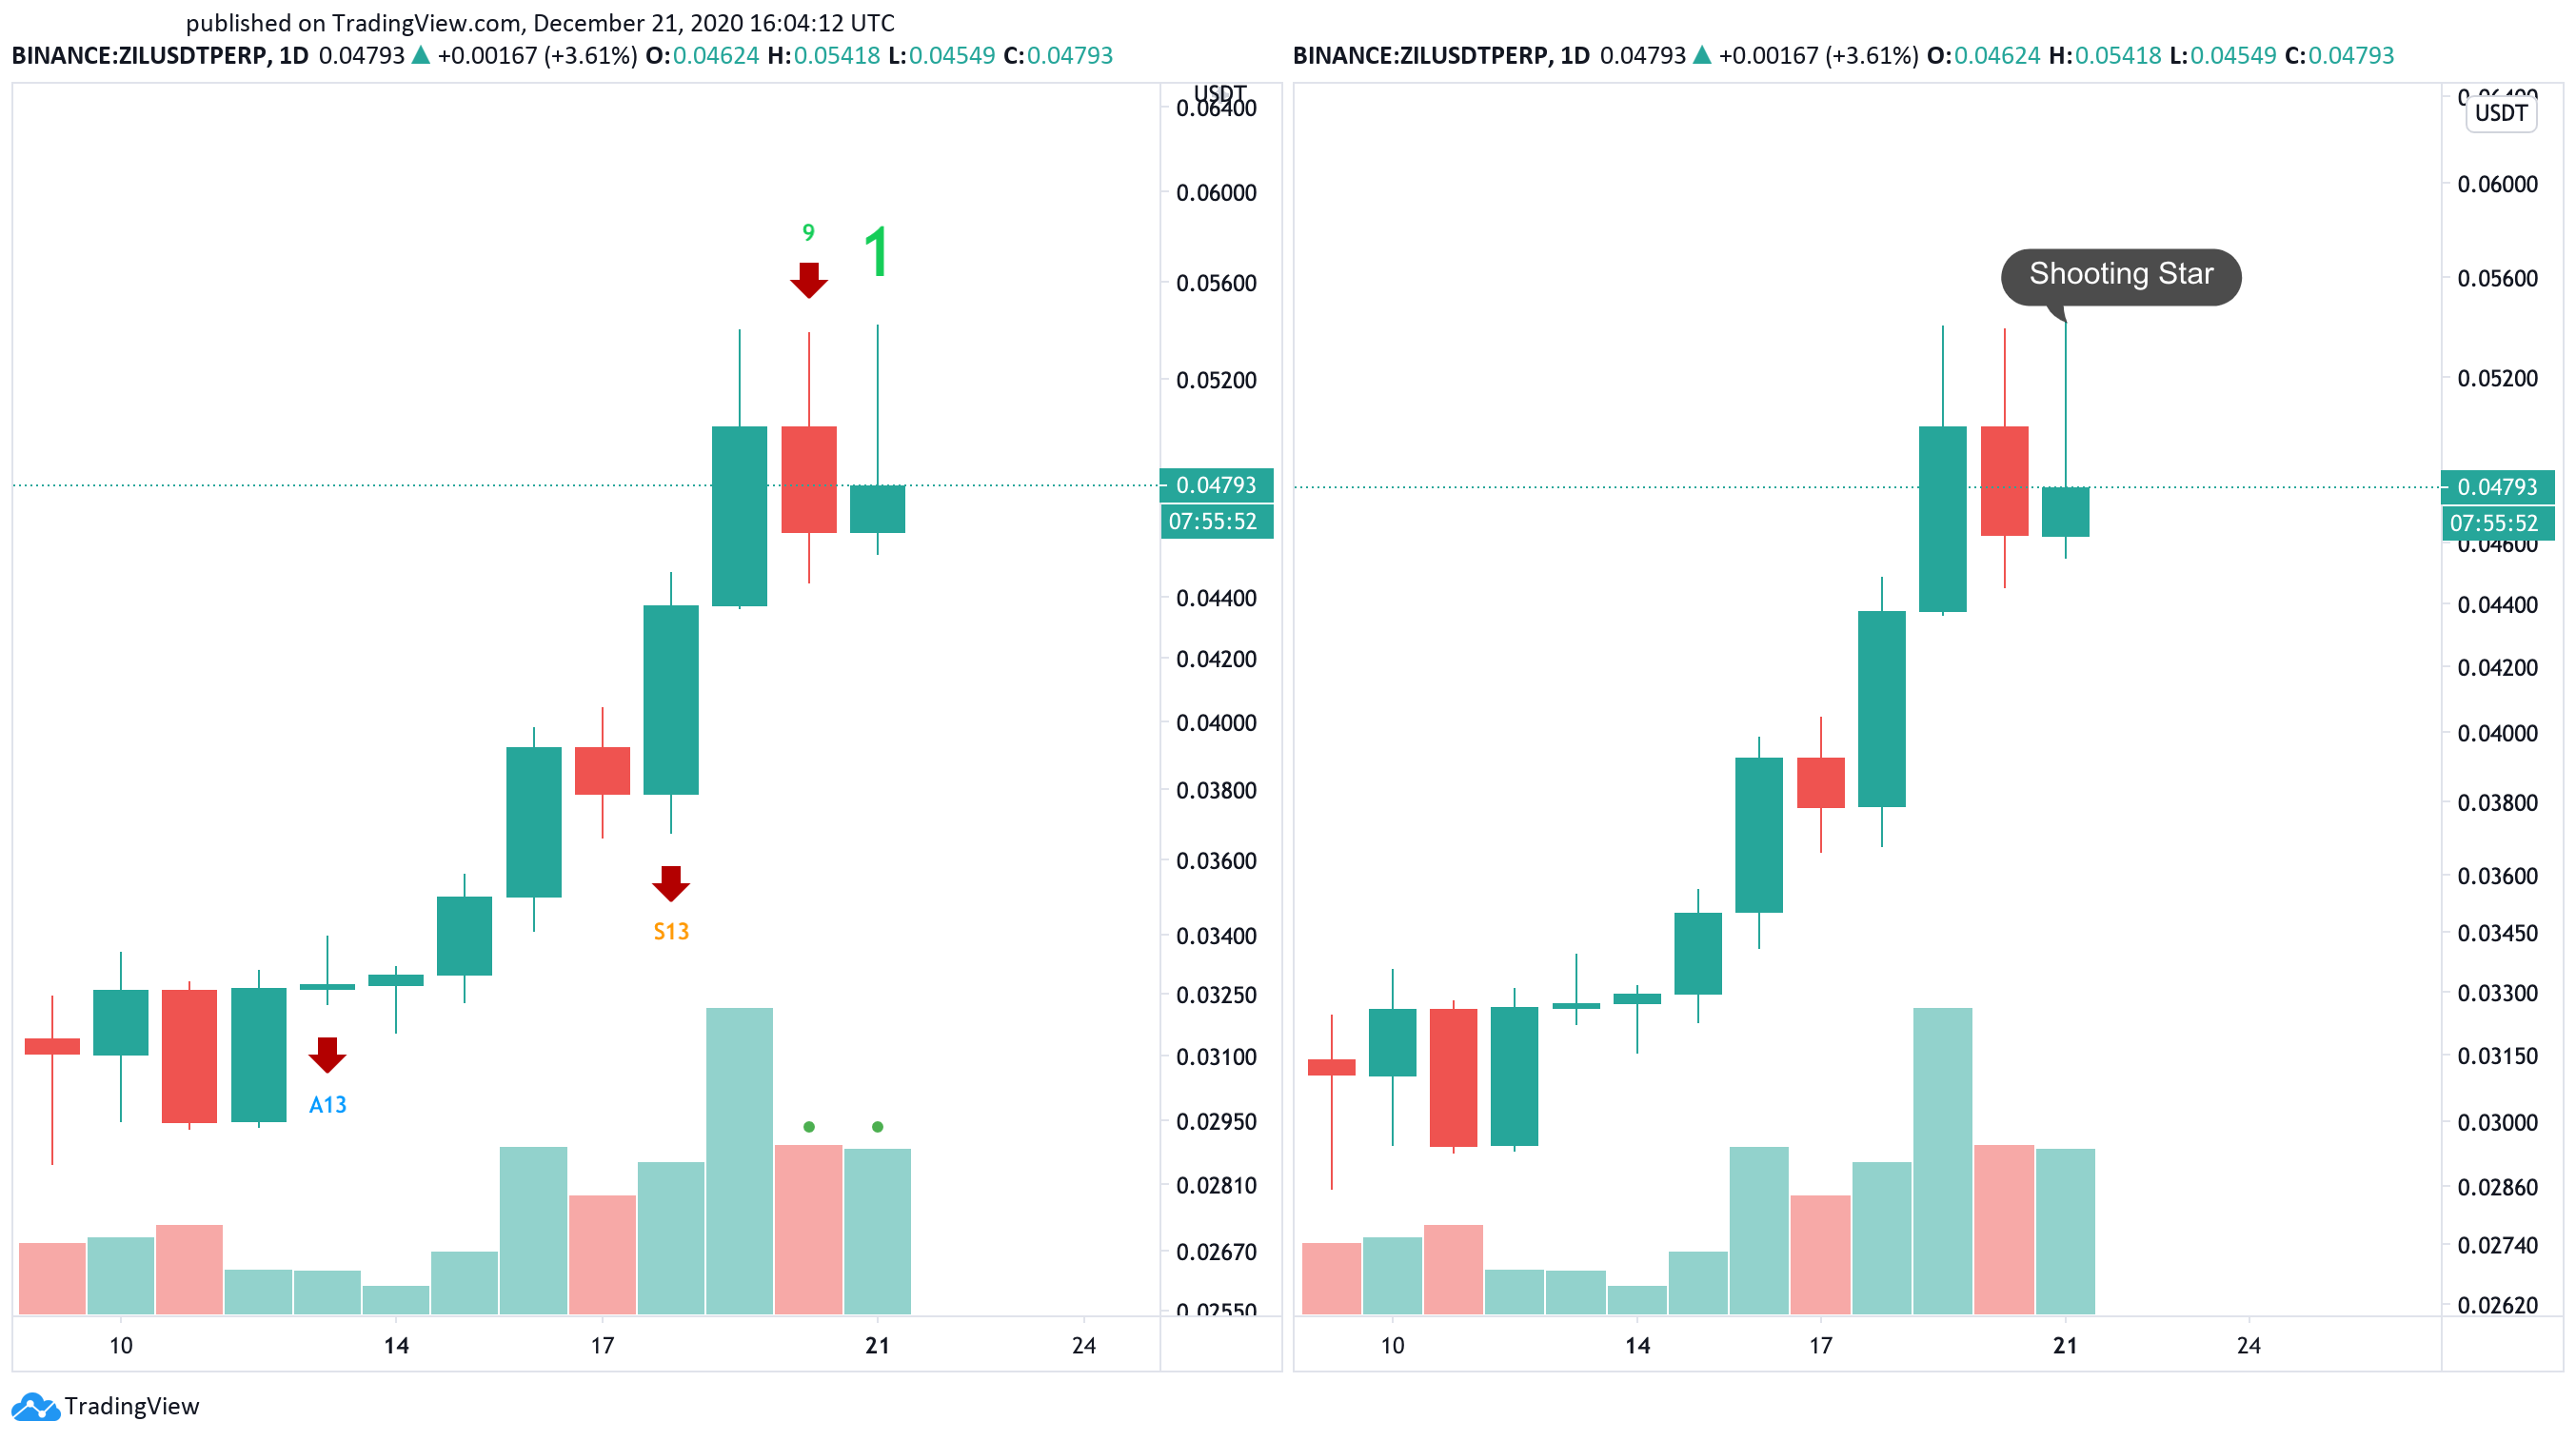
The TD sequential indicator recently presented a sell signal that developed as a green nine candlestick. The bearish formation anticipates up to four daily candlesticks correction, which may serve as an opportunity for sidelined investors to re-enter the market.
The appearance of a shooting star candlestick within the same time frame adds credence to the near-term bearish outlook. It indicates that buyers are losing control as time goes by.
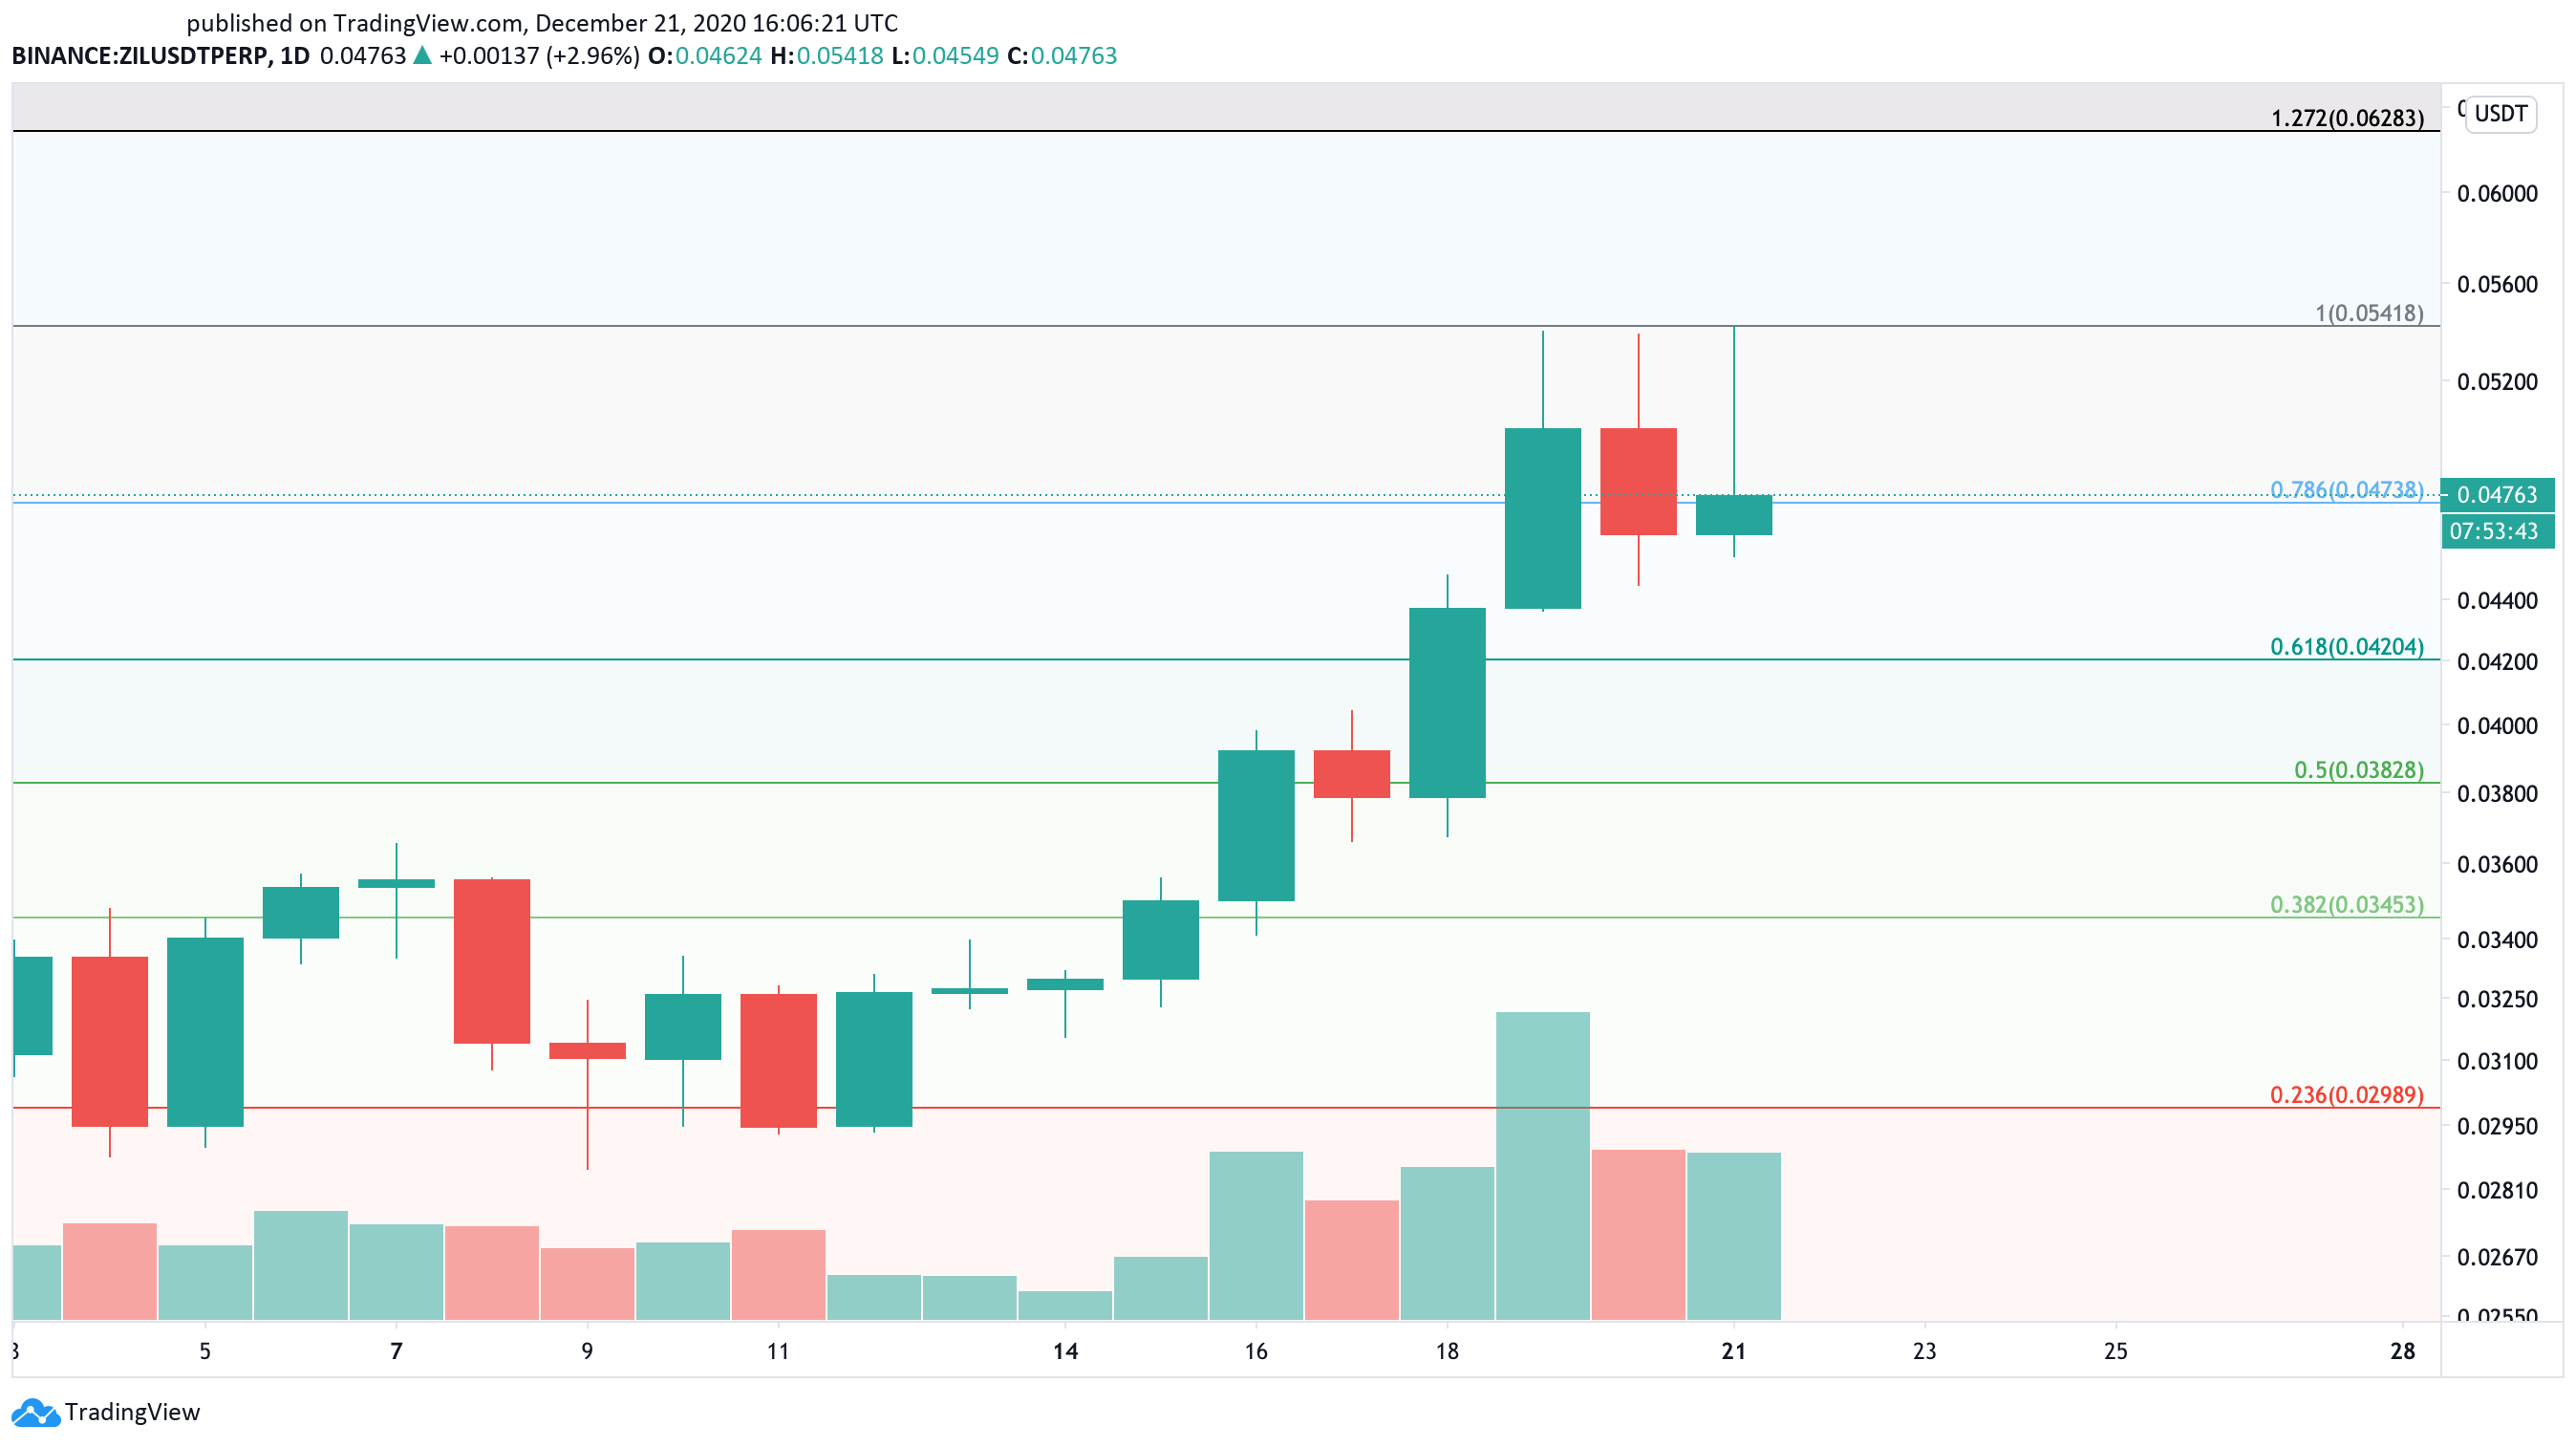
If an increase in sell orders around the current price levels pushes Zilliqa to close below the 78.6% Fibonacci retracement level, that would confirm the bearish formations. Under such circumstances, ZIL will likely drop to the 50% or 38.2% Fibonacci retracement levels.
These critical areas of support sit at $0.038 and $0.034, respectively.
Regardless of the high probability of a downswing before higher highs, Zilliqa looks unstoppable at current levels.
A further increase in buying pressure that sends ZIL above its recent high of $0.054 can invalidate the pessimistic outlook. If this happens, the uptrend would resume targeting $0.070 before the next pullback.
At the time of writing this author held Bitcoin and Ethereum.