0x Price Analysis ZRX / USD: Testing Bulls’ Patience
0x is spiraling down to its supports.

Share this article
- 0x has a bearish short-term bias, with the cryptocurrency trading below its 200-period moving average on the four-hour time frame
- The four-hour time frame continues to show a valid inverted head and shoulders pattern
- The daily time frame highlights growing downside pressure over the medium-term
0x / USD Short-term price analysis
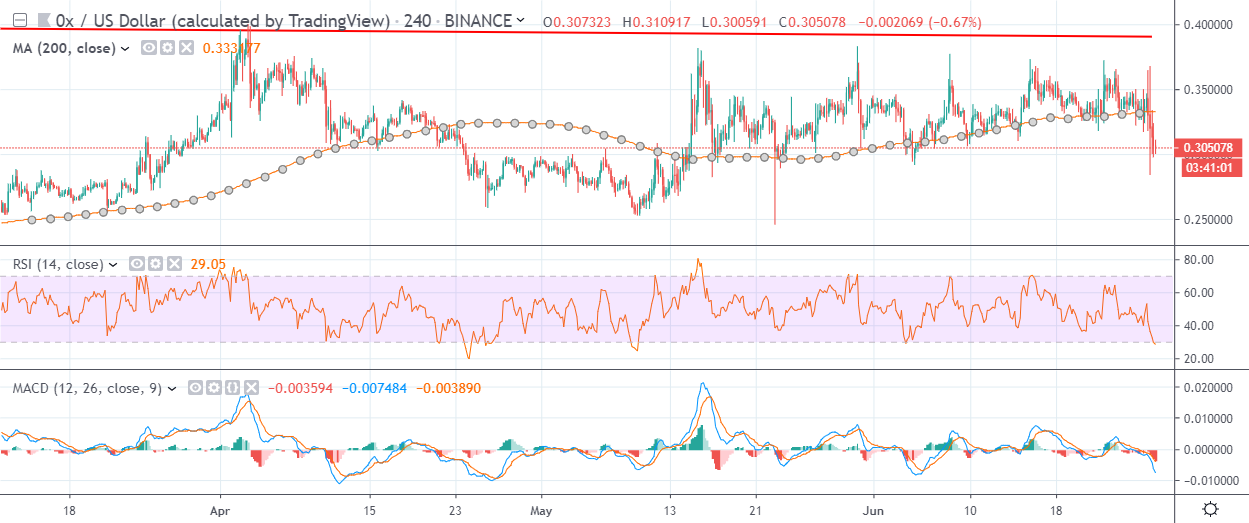
0x has a bearish short-term bias, with the cryptocurrency trading below its 200-period moving average on the four-hour time frame.
The four-hour time frame continues to show a valid inverted head and shoulders pattern, with ZRX / USD pair slipping dangerously close to major technical support.
Technical indicators on the four-hour time frame are bearish and continue to generate a strong sell signal.
Pattern Watch
Traders should note that any invalidation of the bullish pattern on the four-hour time frame will be taken as bearish trading signal in the short-term.
Relative Strength Index
The RSI indicator is also bearish on the four-hour time frame and is approaching oversold territory.
MACD Indicator
The MACD indicator has turned bearish on the four-hour time frame and is currently generating a strong sell signal.
0x / USD Medium-term price analysis
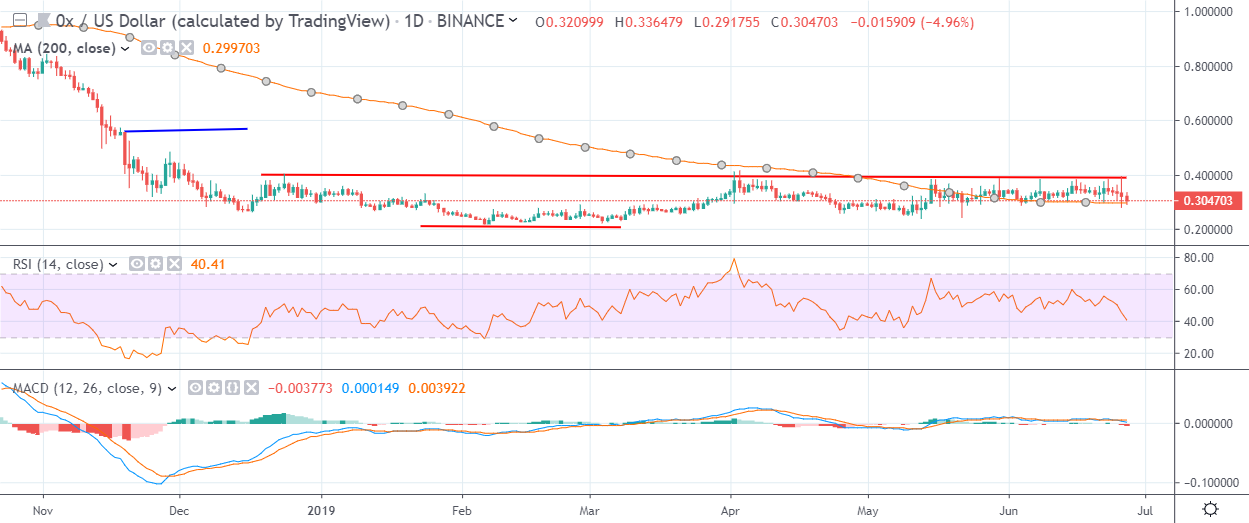
0x has a neutral medium-term outlook, with the cryptocurrency testing towards its trend defining 200-day moving average.
The daily time frame is showing that bulls have failed to participate in the recent cryptocurrency market rally, with the ZRX / USD pair trapped inside a period of sideways price consolidation.
Technical indicators on the daily time frame are bearish and are starting to generate a medium-term sell signal.
Pattern Watch
Traders should note that an extremely large inverted head and shoulder pattern remains valid on the daily time frame.
Relative Strength Index
The RSI indicator on the daily time frame is bearish and is currently issuing a sell signal.
MACD Indicator
The MACD indicator is also neutral on the four-hour time frame and is starting to issue a sell signal.
Conclusion
0x is starting to come under pressure across both time frames as bulls lose patience with the cryptocurrency, leaving the-door-open for technical selling.
With technical indicators turning lower, all eyes are now focused on the ZRX / USD pair’s 200-day moving average.
Check out our guide to the 0x DEX network.
Our deep dive DARE into the project is available here.
Share this article
