0x Price Analysis ZRX / USD: Recovery Attempts
ZRX is trying to recover from from bearish trend.

Share this article
- 0x has a bearish short-term trading bias, with the cryptocurrency trading at its weakest level since November 2017
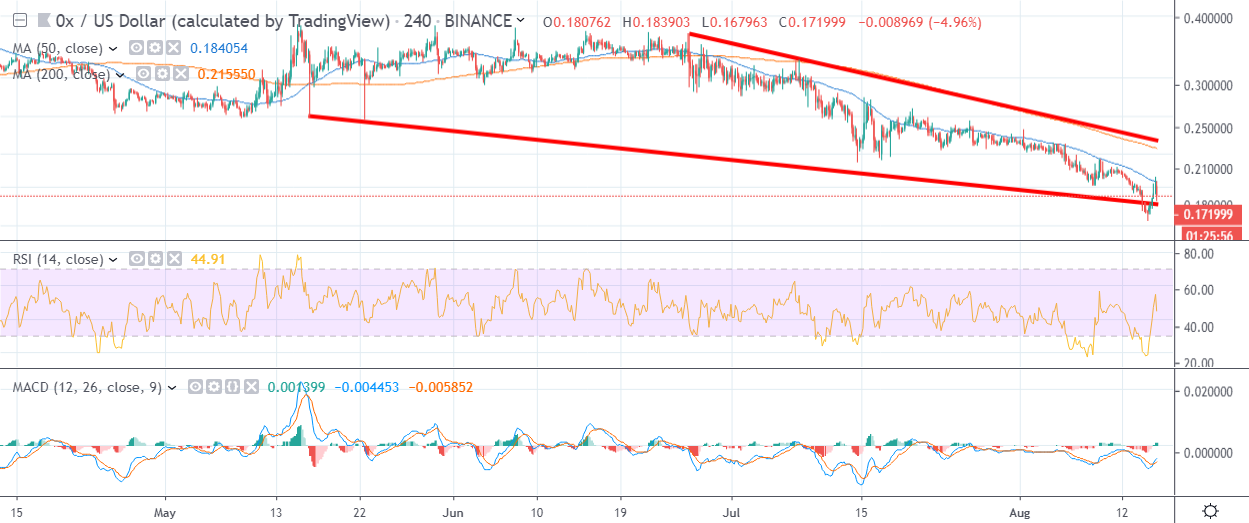
- The four-hour time frame shows that a large falling wedge pattern has formed
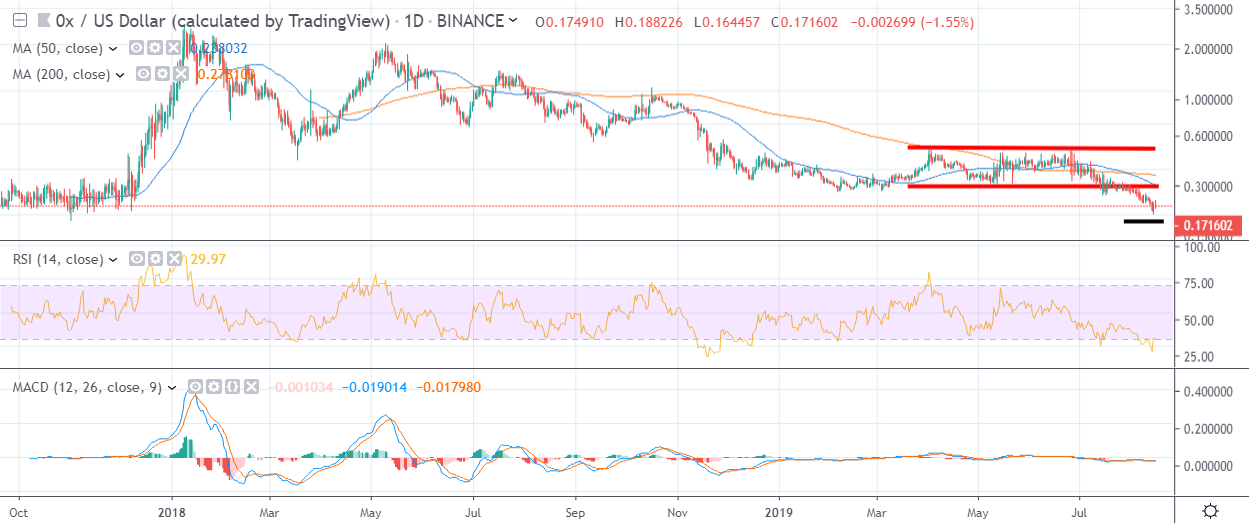
- The daily time frame shows that the ZRX / USD pair has undergone a major decline after breaking from a horizontal price channel
0x / USD Short-term price analysis
0x has a bearish short-term outlook, with the cryptocurrency declining towards its all-time trading low.
The four-hour time frame shows that a falling wedge pattern has now formed, with the ZRX / USD pair performing a minor bounce from key trendline support.
Technical indicators on the four-hour time frame are attempting to correct from extremely oversold conditions.
Pattern Watch
Traders should note that falling wedge patterns are typically considered to be bullish reversal patterns.
Relative Strength Index
The RSI indicator is also bullish on the four-hour time frame and is now issuing a buy signal.
MACD Indicator
The MACD indicator has turned bullish on the four-hour time frame and is currently generating a strong buy signal.
0x / USD Medium-term price analysis
0x has a bearish medium-term outlook, with the 50-day moving average crossing over the 200-day moving average.
The daily time frame is showing that a major range break has occurred from a horizontal price channel, sparking a major technical sell-off in the ZRX / USD pair.
Technical indicators on the daily time frame are still bearish and remain in oversold territory.
Pattern Watch
Traders should note that a major double-bottom could form if the current all-time trading low holds firm.
Relative Strength Index
The RSI indicator on the daily time frame is attempting to recover, although it remains technically bearish.
MACD Indicator
The MACD is flatlined on the four-hour time frame and is failing to generate a clear trading signal.
Conclusion
0x has come under heavy downside selling pressure, following a bearish technical breakout from its four-month trading range.
The bullish pattern on the four-hour time frame shows that the cryptocurrency could soon experience a strong bounce, although bulls need to continue to defend the ZRX / USD pair’s all-time trading low.
Check out our guide to the 0x DEX network.
Our deep dive DARE into the project is available here.
Share this article
