0x Price Analysis ZRX / USD: Uncertain Future
Short-term bears invalidated the longer-term bullish prospects.

Share this article
- 0x has a bearish short and medium-term trading bias, with the cryptocurrency trading below key support on both time frames
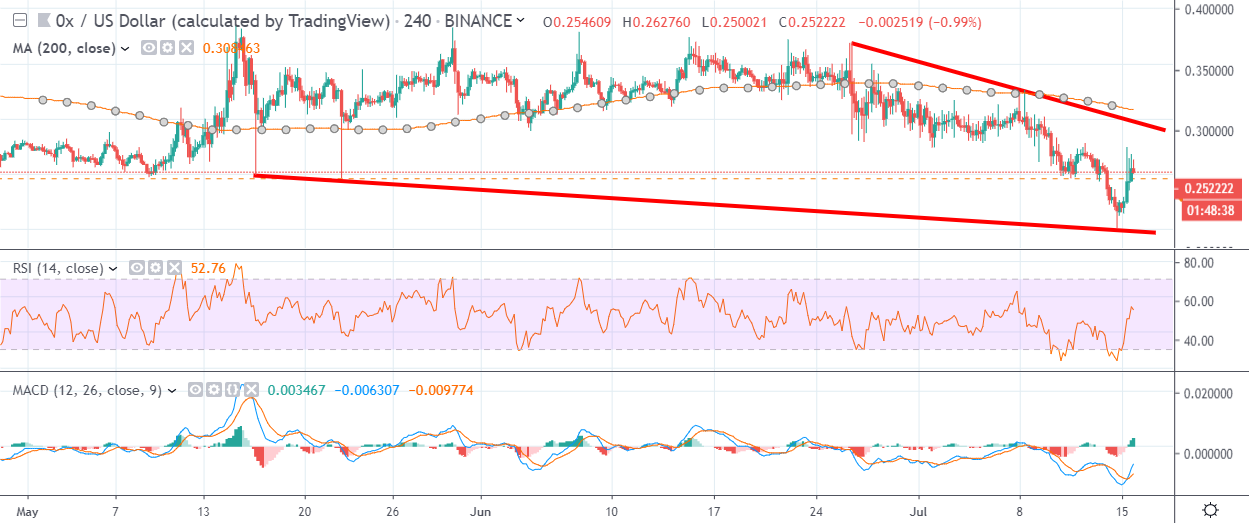
- The four-hour time frame shows that a bullish falling wedge pattern has formed
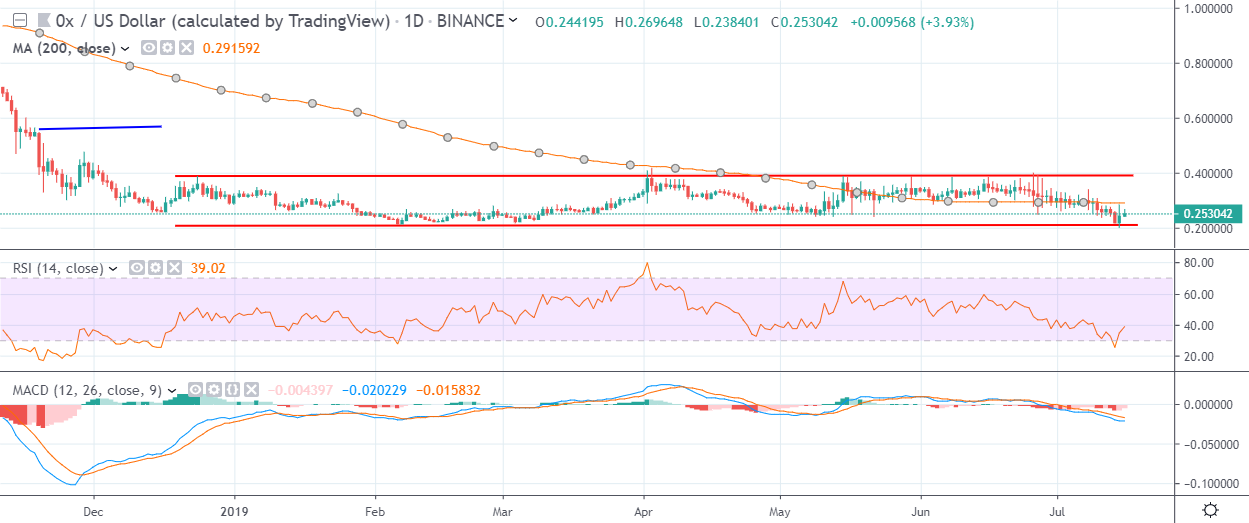
- The daily time frame shows that an inverted head and shoulders pattern has formed
0x / USD Short-term price analysis
0x has a bearish short-term bias, with the cryptocurrency trading well below its 200-period moving average on the four-hour time frame.
The four-hour time frame shows that a falling wedge pattern has now formed, with the ZRX / USD pair bouncing sharply from major trendline support.
Technical indicators on the four-hour time frame are bullish and continue to generate a strong buy signal.

Pattern Watch
Traders should note that falling wedge patterns are typically considered to be bullish reversal patterns.
Relative Strength Index
The RSI indicator has also turned bullish on the four-hour time frame and is now issuing a solid buy signal.
MACD Indicator
The MACD indicator has turned bullish on the four-hour time frame and is currently generating a strong buy signal.
0x / USD Medium-term price analysis
0x has a bearish medium-term outlook, with the cryptocurrency continuing to trade below its trend defining 200-day moving average.
The daily time frame is showing that the recent decline in the ZRX / USD pair has invalidated a bullish inverted head and shoulders pattern that has been in play since the start of the year.
Technical indicators on the daily time frame are still turning lower and continuing to issue a sell signal.

Pattern Watch
Traders should note that a neutral sideways price channel has now formed on the daily time frame.
Relative Strength Index
The RSI indicator on the daily time frame is attempting to recover, although it remains technically bearish.
MACD Indicator
The MACD indicator is bearish on the daily time frame and continues to issue a sell signal.
Conclusion
0x has staged a strong recovery from key support across both time frames, with short-term indicators continuing to point to further near-term gains for the cryptocurrency.
The recent invalidation of the inverted head and shoulders patterns on the daily time frame has made the ZRX / USD pair’s medium-term outlook more uncertain.
Check out our guide to the 0x DEX network.
Our deep dive DARE into the project is available here.
Share this article
