 Earn with Nexo

ABT / BTC Price Analysis: Arc of Strange Gains
Arcblock rose 200% in the last two weeks despite not having any notable developments.
- Arcblock has a bullish short-term trading bias, with the ABT / BTC pair advancing to a fresh 2019 trading high
- The ABT / BTC pair’s medium-term outlook is bullish, with price now trading above its 200-day moving average
- The daily time frame is showing that a large bullish pattern may be taking shape.
Arcblock / Bitcoin Short-term price analysis
ABT has turned bullish against Bitcoin in the short-term, with the cryptocurrency surging to a fresh 2019 trading high.
The four-hour time frame is showing a large inverted head and shoulders pattern has been triggered, with the ABT / BTC pair rallying strongly since breaking above neckline resistance.
Technical indicators are bullish on the four-hour time frame, although they are starting to appear overstretched.
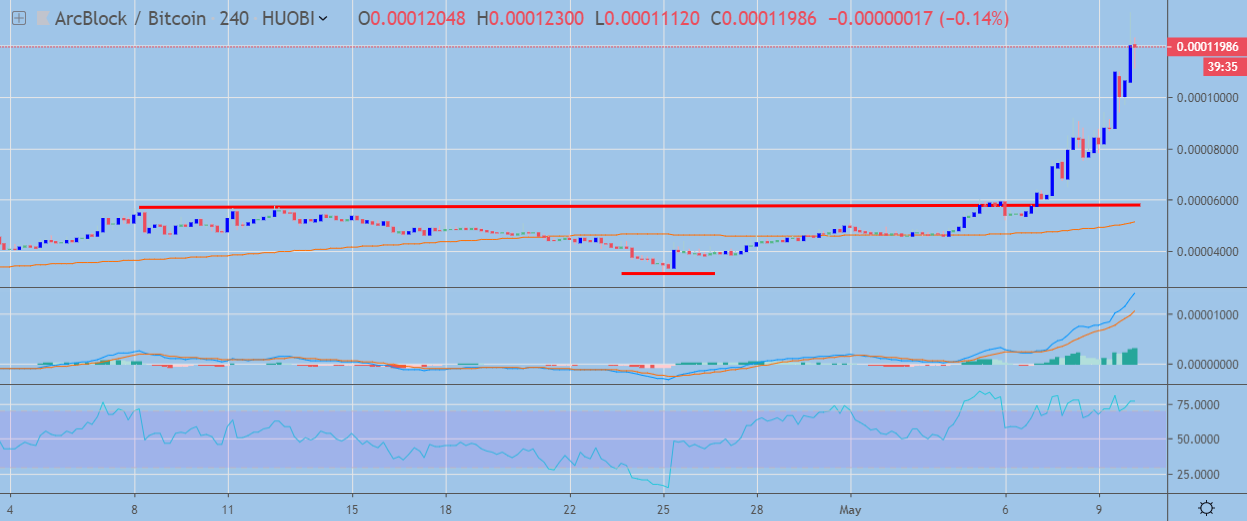 ABT / BTC H4 Chart by TradingView
Pattern Watch
Traders should note that the ABT / BTC pair has now extended beyond the bullish target of the inverted head and shoulders pattern on the four-hour time frame.
Relative Strength Index
The Relative Strength Index on the four-hour time frame is bullish, although it is now extremely overbought.
MACD Indicator
The MACD indicator on the four-hour time frame remains bullish and continues to generate a strong buy signal.
Fundamental Analysis
Although ABT price has increased over 200% for the past two weeks, it’s hard to find any meaningful reasons that are driving this upwards momentum. In fact, this looks like an attempt to pump the coin, since ABT is primarily trading on exchanges that are known for inflating trade figures.
Arcblock / Bitcoin Medium-term price analysis
ABT has turned bullish against Bitcoin over the medium-term, with the ABT / BTC pair advancing well above its trend defining 200-day moving average.
The daily time frame is showing that an inverted head and shoulders pattern has been triggered, with the bullish pattern now reaching its full upside potential.
Technical indicators on the daily time frame are bullish, although they are starting to appear overstretched.
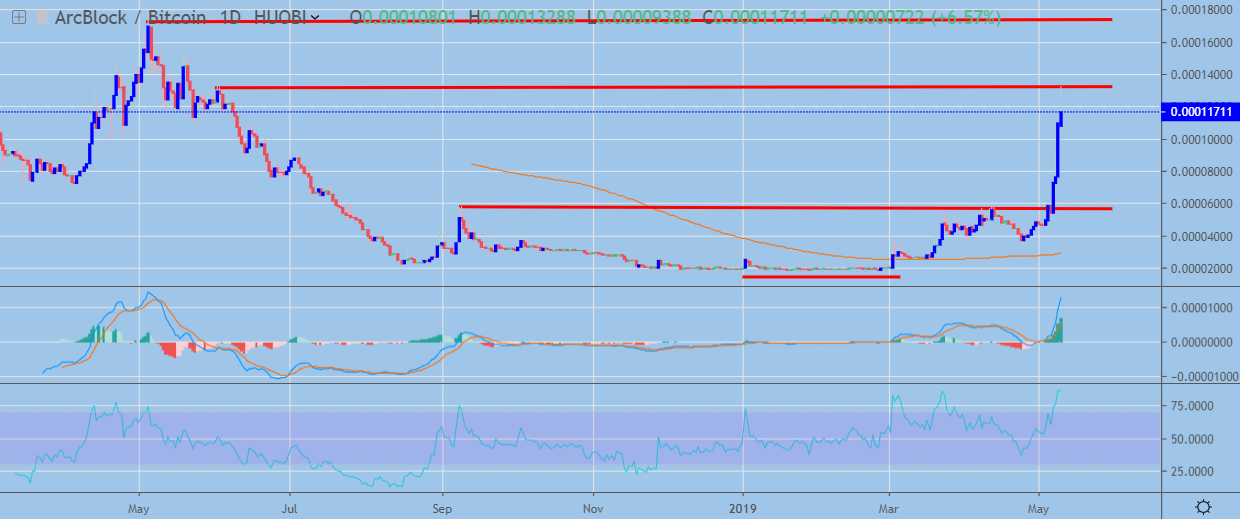 ABT / BTC Daily Chart by TradingView
Pattern Watch
Traders should note that a much larger inverted head and shoulders pattern could start to take shape on the daily time frame.
Relative Strength Index
The RSI indicator has moved into extreme overbought territory on the daily time frame, which could signal an eventual technical correction lower.
MACD Indicator
The MACD indicator is currently generating a strong buy signal on the daily time frame.
Fundamental Analysis
In the medium term, the project looks speculative. Such a high increase in price will likely result in the correction of a similar magnitude, unless the project implements fundamentals that could support its current value.
Conclusion
Both the four-hour and daily time frames highlight the strong bullish breakout that has recently occurred in the ABT / BTC pair.
Traders should monitor the daily time frame closely, if the recent rally continues then a much larger inverted head and shoulders pattern could start to form.
However, the unusual pattern should be noted, and if no discernible reason for the increase appears soon, the possibility of a correction must not be ruled out.