Aeternity Price Analysis AE / USD: Nothing Lasts Forever
Aeternity is looking bearish on almost all indicators, with multiple bearish patterns forming.

Share this article
- Aeternity is bearish in the short-term, with the cryptocurrency still trading well below its 200-period moving average on the four-hour time frame
- Both the four-hour and the daily time frames show bearish head and shoulders patterns
- The medium-term technical outlook remains bearish, with the AE / USD pair still trading below its 200-day moving average
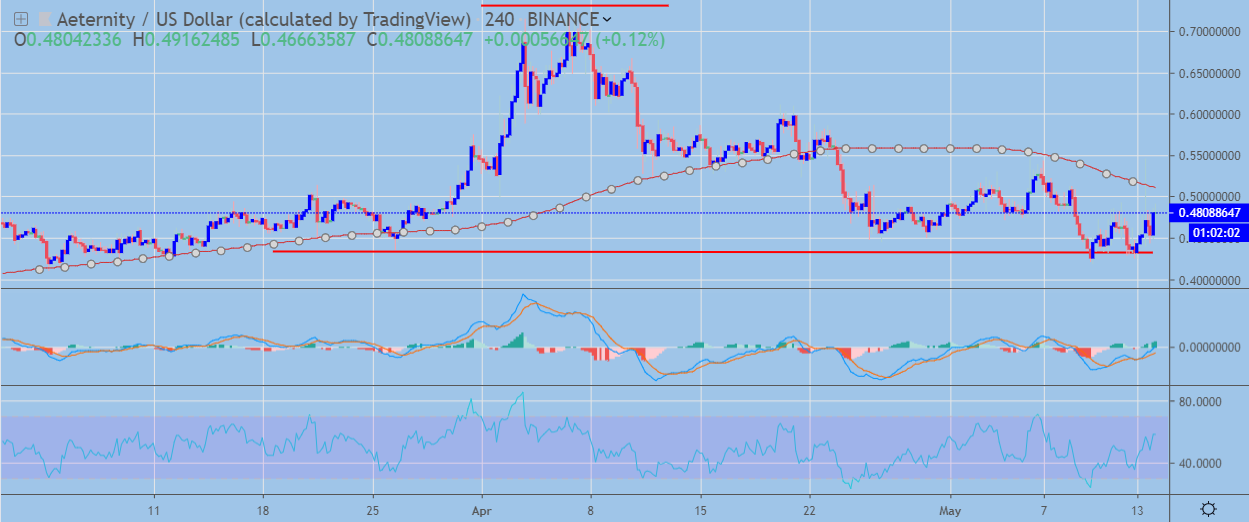
Aeternity / USD Short-term price analysis
Aeternity has a bearish short-term trading outlook, with the cryptocurrency still trading below its 200-period moving average on the four-hour time frame.
The four-hour time frame shows a large head and shoulders pattern, with the AE / USD pair trading dangerously close to the neckline of the bearish pattern.
Technical indicators on the four-hour time frame have turned bullish as the cryptocurrency moves away from critical support.
 AE / USD H4 Chart by TradingView
Pattern Watch
Traders should note that if the bearish pattern is triggered on the four-hour time frame the AE / USD pair may fall towards the December 2018 monthly trading low.
Relative Strength Index
The Relative Strength indicator has turned bullish on the four-hour time frame and shows scope for a potential upside.
MACD Indicator
The MACD indicator on the four-hour time frame has turned bullish and is issuing a buy signal.
Aeternity / USD Medium-term price analysis
Aeternity has a bearish medium-term bias, with the AE / USD pair still trading well below its trend defining 200-day moving average.
The daily time frame shows that a bearish head and shoulders pattern could be forming, as the AE / USD pair continues to fall away from the best levels of the year.
Technical indicators on the daily time frame remain bearish and still show scope for further downside.
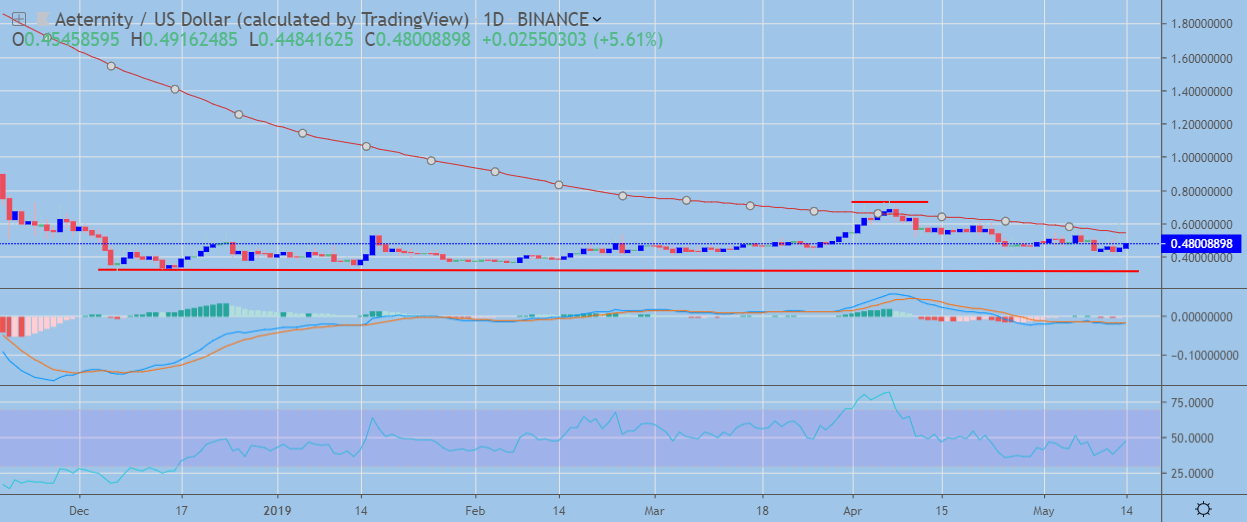 AE / USD Daily Chart by TradingView
Pattern Watch
AE/USD bulls will need to work hard to negate the potential large head and shoulders pattern forming on the daily time frame.
Relative Strength Index
The Relative Strength indicator remains bearish on the daily time frame, although it is attempting to move higher.
MACD Indicator
The MACD indicator on the daily time frame has a slight bearish bias and may continue to turn lower.
Conclusion
Aeternity has been gradually eroding last months strong gains and is looking increasingly bearish over both the four-hour and daily time frames.
Bulls now need to work extremely hard to shift the overall negative bias, with the bearish pattern on the four-hour time frame offering a potential indication of the AE / USD pair’s likely near-term path.
Our coin guide for Aeternity is perfect to learn the basics of the project.
Share this article
