Avalanche Aims for New Highs Following Rebound
Avalanche looks bullish as long as it continues to trade above $80, with one formation indicating that it could rise toward record highs.

Key Takeaways
- Avalanche has surged by more than 12% in the past three days.
- The bullish impulse came after AVAX rebounded from a critical support level.
- Now, AVAX looks primed to resume its uptrend toward $127.
Share this article
Avalanche appears to have completed a retest of a crucial support level and now looks primed to rally. As sidelined investors re-enter the market, AVAX could aim for a new all-time high.
Avalanche Targets Record Highs
Avalanche could soon re-enter price discovery mode and head toward triple digits territory for the first time.
The 13th-ranked cryptocurrency by market cap broke out of a symmetrical triangle on Nov. 7 after enduring a two-month-long consolidation period. The bullish continuation pattern anticipated that AVAX was primed for a 55% upswing toward $127 after overcoming the $80 resistance level.
The optimistic target is derived from measuring the distance between the two highest points of the triangle and adding it to the breakout point.
Avalanche was able to hit a new all-time high of $97 shortly after slicing through the symmetrical triangle. However, a spike in profit-taking led to a 19% correction that pushed AVAX down to retest the pattern’s x-axis at $80.
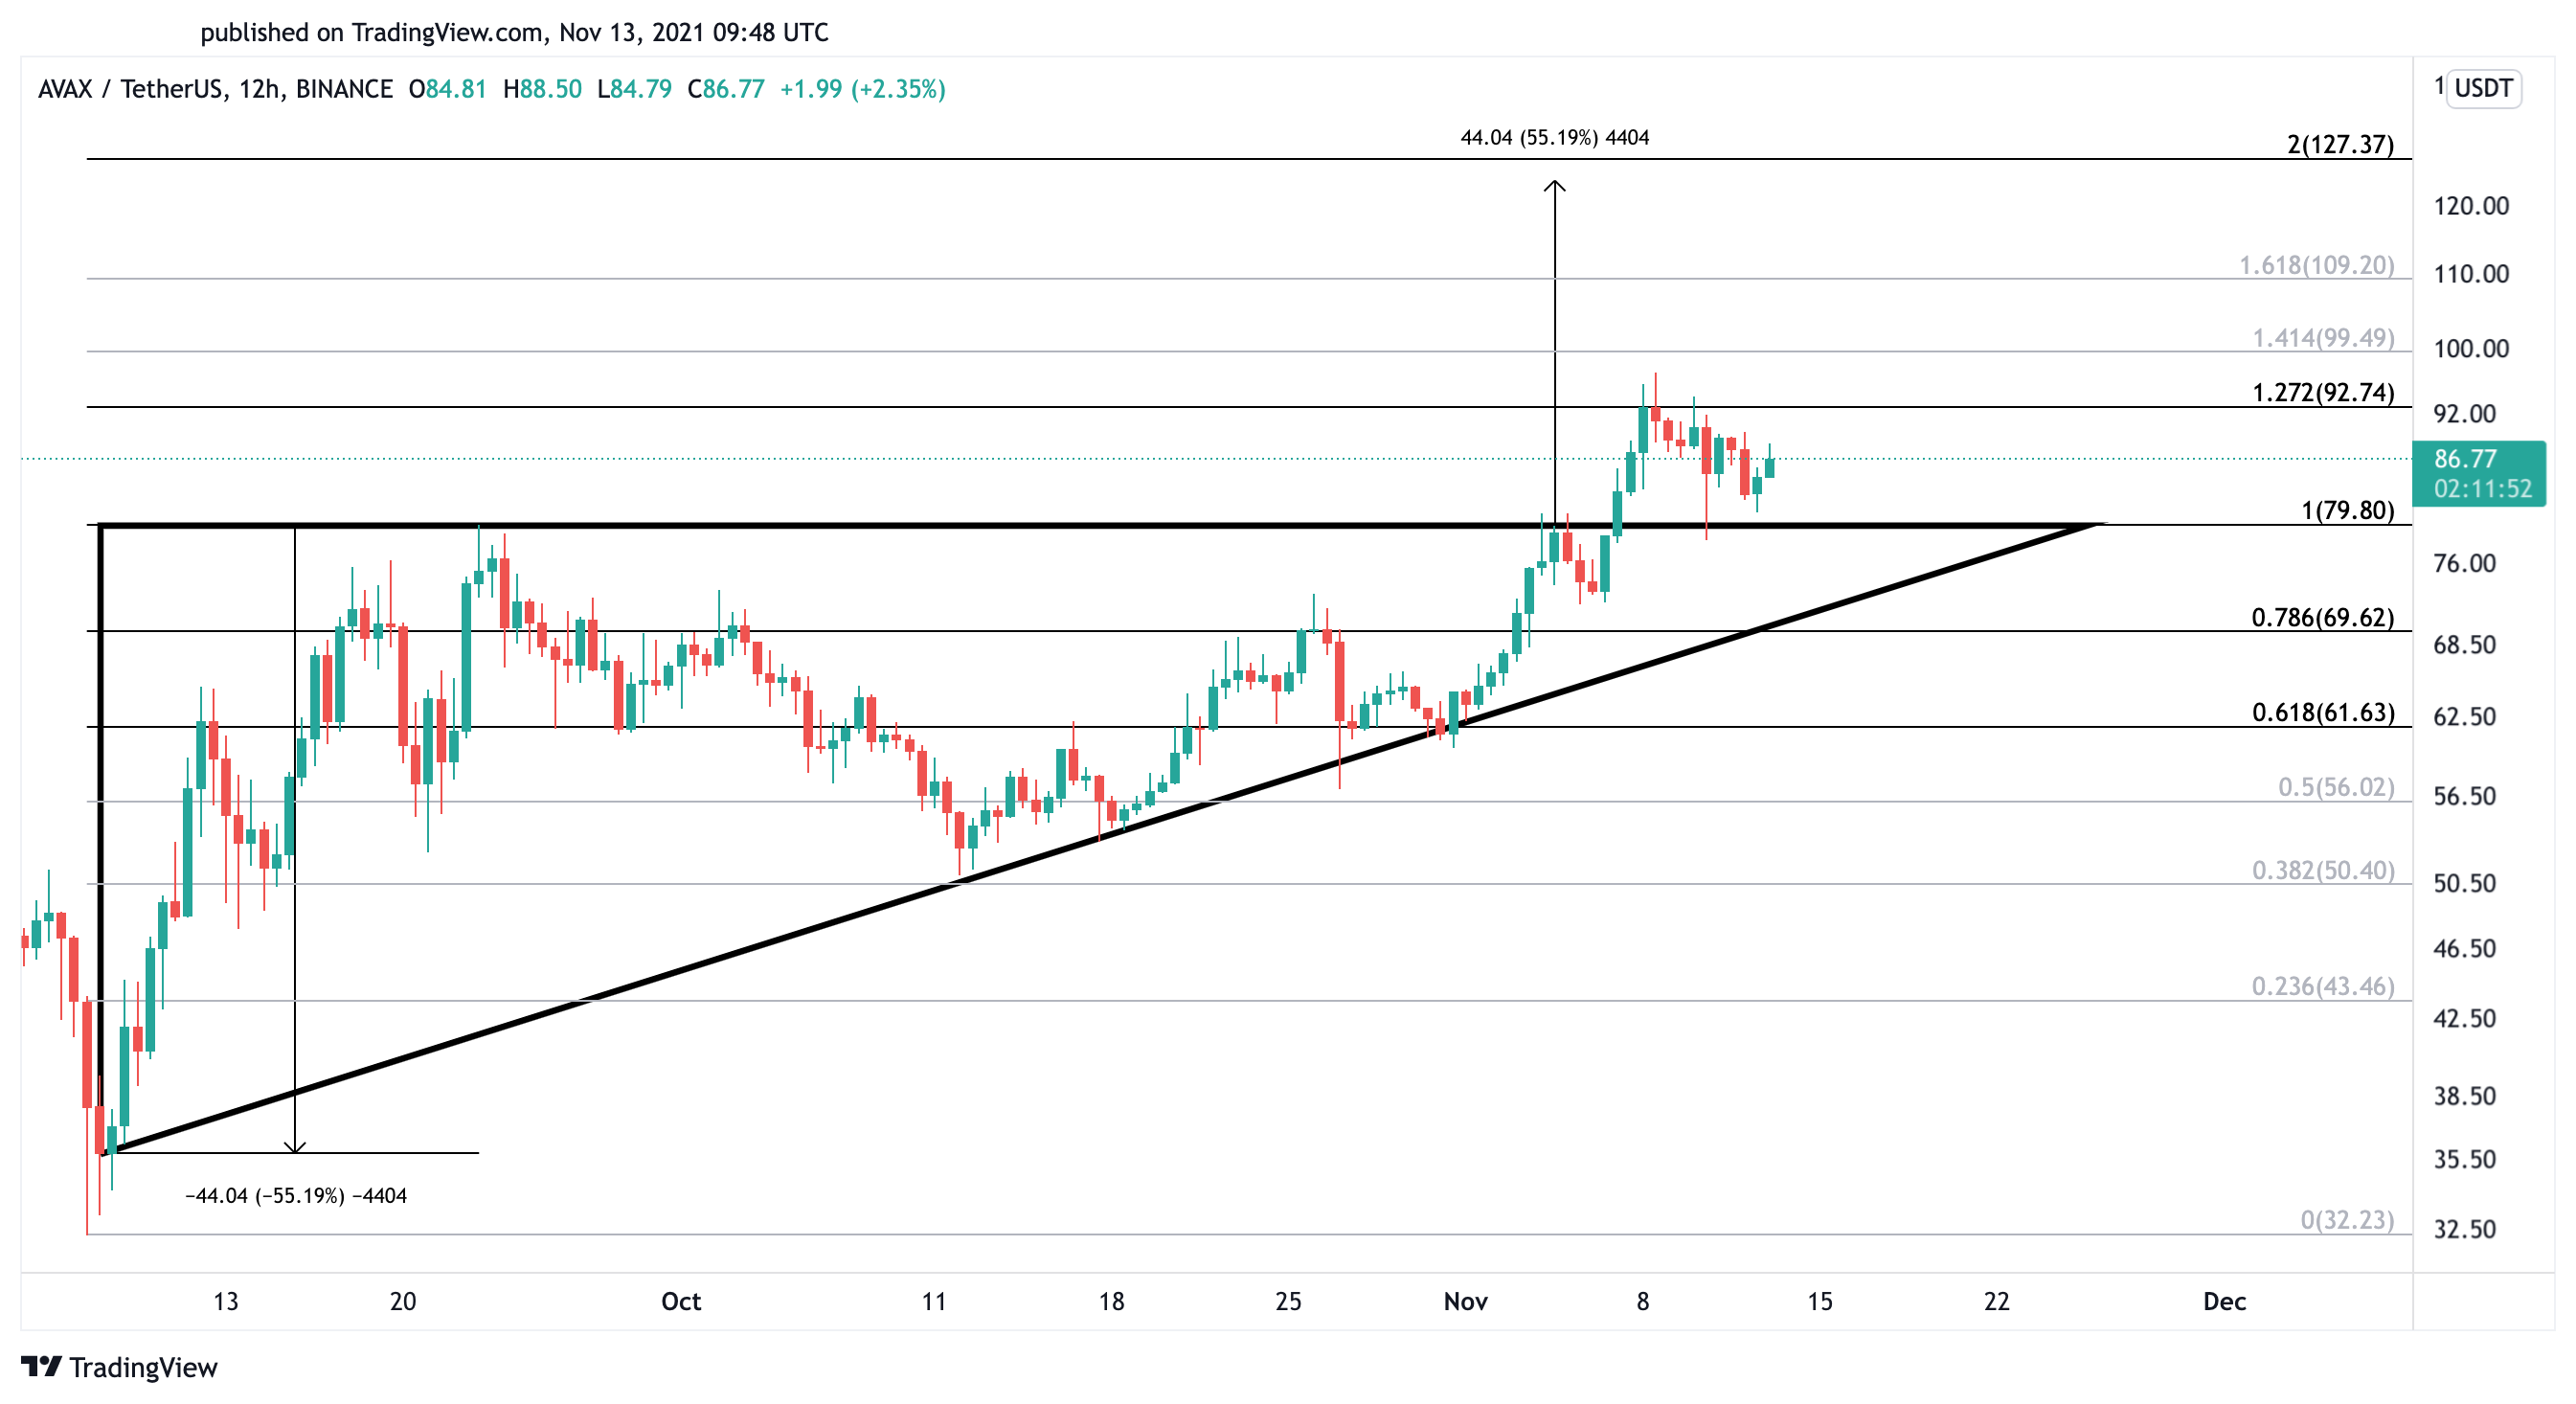
Sidelined investors appear to have taken advantage of the pullback to get back into the market. The spike in buying pressure allowed Avalanche to rebound and print a higher low in the 12-hour chart. Now, AVAX must overcome the $93 resistance level to achieve its upside potential.
Breaching such a significant supply barrier could catapult Avalanche toward $127 to reach the target presented by the ascending triangle pattern. The Fibonacci retracement indicator, measured from the Sep. 7 low at $32.23 to the Sep. 23 high of $79.80, suggests that AVAX could face resistance at $100 and $110 on its ascent.
It is worth noting that AVAX must continue to trade above $80 for the optimistic outlook to be validated. Any signs of weakness at this support level could encourage traders to exit their long positions in anticipation of a steeper correction. The rising downward pressure could then push the asset toward $70 or even $60.
Disclosure: At the time of writing, the author of this feature owned BTC and ETH.
Share this article
