
BCH / USD Price Analysis: High Selling Pressure
Bitcoin Cash is looking bearish in all time frames, though some indicators show it's oversold.
- BCH has a bearish short-term bias, with the BCH / USD pair trading well below its 200-period moving average on the four-hour time frame
- BCH now has a neutral medium-term trading bias
- Sellers are testing towards the BCH / USD pair’s 200-day moving average
BCH / USD Short-term price analysis
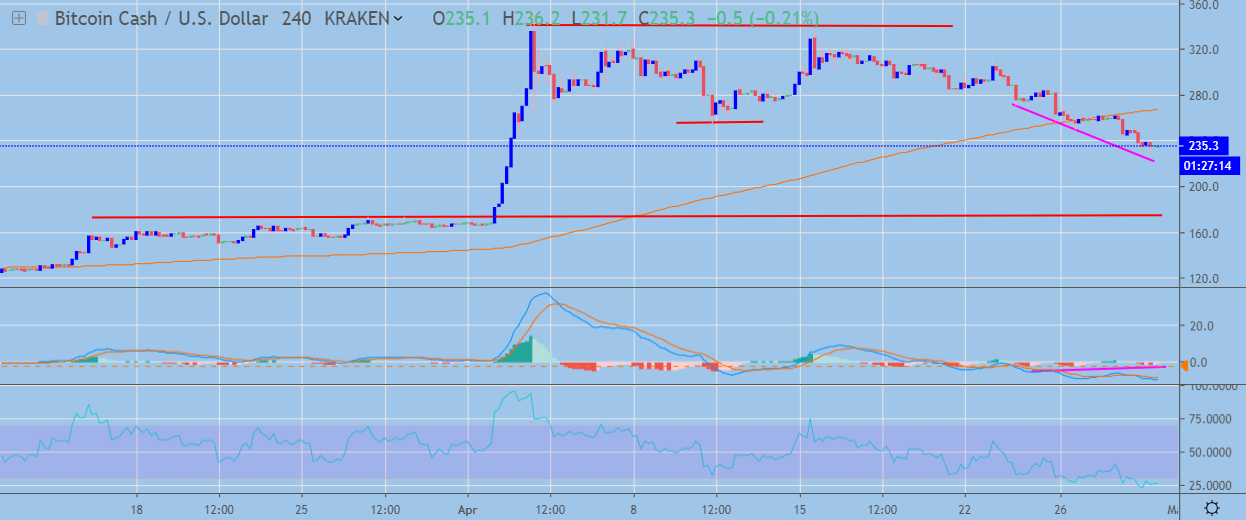
BCH has a bearish short-term trading bias, with the BCH / USD pair now trading below its 200-period moving average on the four-hour time frame.
The four-hour time frame is currently showing that the recent sharp decline in the BCH / USD pair has invalidated a bullish inverted head and shoulders pattern.
Technical indicators on the four-hour time frame are bearish, although they are currently oversold.
 BCH / USD H4 Chart by TradingView
Pattern Watch
Traders should note that the bearish target of the invalidated inverted head and shoulders pattern extends towards the April 2nd swing-low.
Relative Strength Index
The RSI indicator on the four-hour time frame is bearish, although it is currently extremely oversold.
MACD Indicator
The MACD indicator on the four-hour time frame is bearish, although bullish MACD divergence is present.
BCH / USD Medium-term price analysis
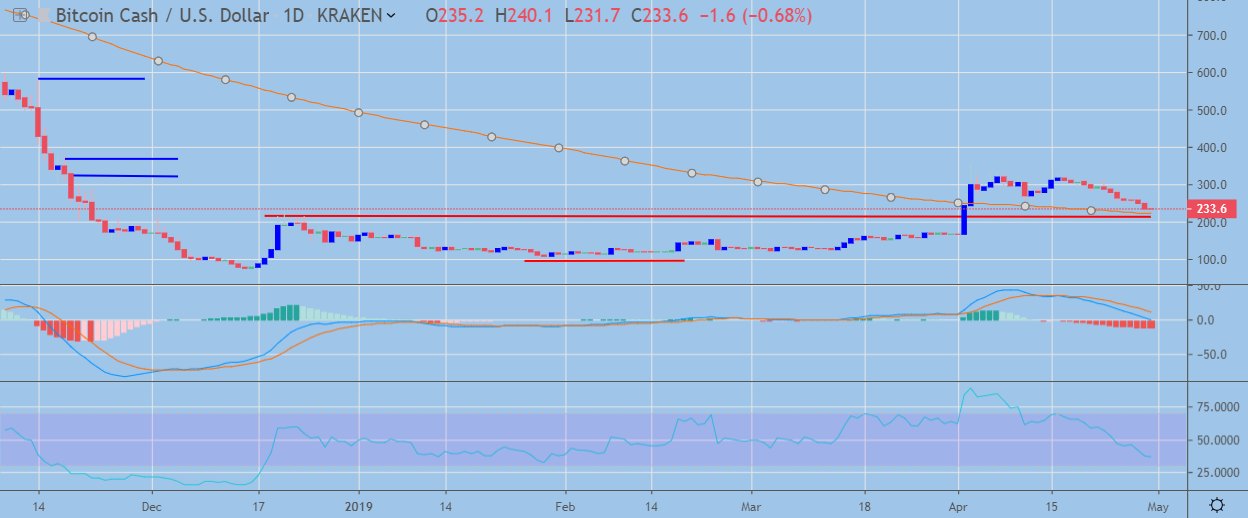
BCH has a neutral medium-term trading outlook, with the BCH / USD pair testing towards its trend defining 200-day moving average.
The daily time frame is currently highlighting the $220.00 and $200.00 levels as major upcoming support levels, with the BCH / USD pair offering limited technical support until the $174.00 level.
Technical indicators on the daily time frame are heavily bearish and point to further downside for the BCH / USD pair.
 BCH / USD Daily Chart by TradingView
Pattern Watch
Traders should note that a large head and shoulders pattern may start to take shape across the daily time frame if the decline continues.
Relative Strength Index
The RSI indicator on the daily time frame is bearish and shows scope for further downside.
MACD Indicator
The MACD indicator on the daily time frame is heavily bearish, with both the MACD signal and MACD histogram generating sell signals.
Conclusion
BCH’s short-term dynamics have shifted, with the BCH / USD pair now trading below its 200-period average for the first time since March 13th, 2019.
The cryptocurrency also risks turning bearish over the medium-term if sellers force price below the BCH / USD pair’s 200-day moving average over the coming sessions.
For a quick look into Bitcoin Cash and BTC, check out our coin guide here.