Binance Coin Price Analysis BNB/USD: Consecutive Losses
BNB is showing weakness, though there are still possible factors for recovery.
- Binance Coin has a bearish short-term and medium-term trading bias
- The four-hour time frame shows that a bullish inverted head and shoulders pattern is still present
- A loss of the $16.00 level would be extremely bearish for the BNB/USD pair
Binance Coin remains under pressure alongside the broader cryptocurrency market, with the BNB/USD pair trading over 10 percent lower since the start of the trading week.
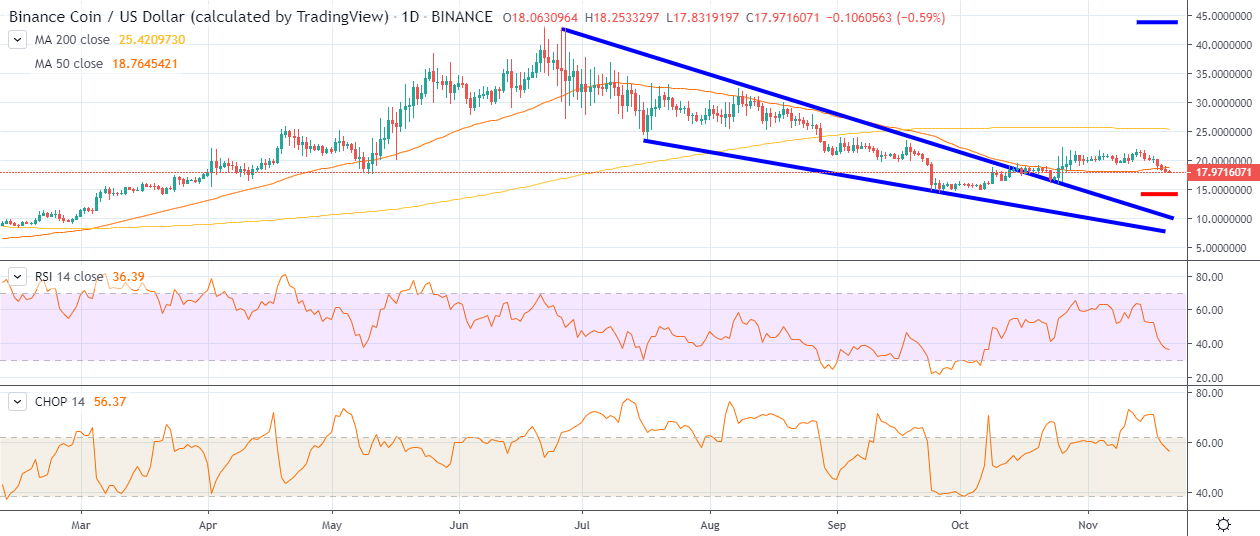
The BNB/USD pair now trades down by over 17.5% from its monthly peak, although it is still trading 200% higher since the start of the year.
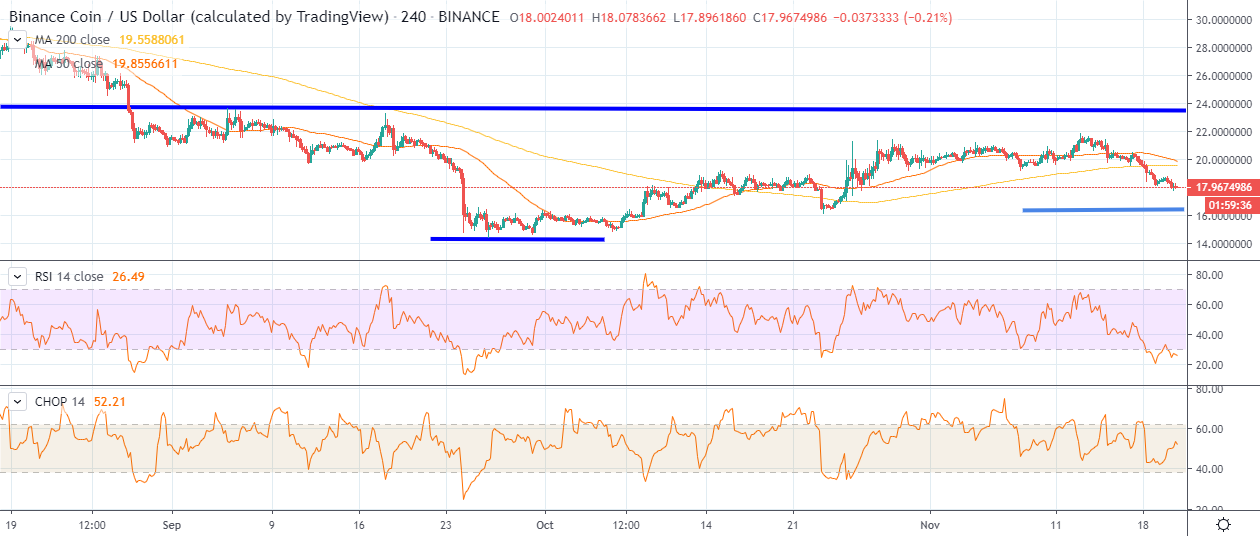
The coin has not traded above its 200-day moving average since August 28th and has now performed two consecutive daily closes below its 50-day moving average, potentially signaling more weakness ahead.
The four-hour time frame shows that an inverted head and shoulders pattern is still present, with buyers needing to defend the $15.00 level to keep the bullish pattern in play.
Medium-term buyers need to advance the BNB/USD pair above the $23.50 level to ignite the inverted head and shoulders pattern, which would mean that a recovery of 30 percent would need to take place from current levels for that scenario to happen.
In the near-term the $16.00 level appears critical, as it marks the important October 23rd swing-low. A recovery above the $19.50 level should ease short-term selling pressure.
The daily time frame continues to show a valid bullish falling wedge breakout in place, with the top of wedge now extending down towards the $9.00 level.
The overall upside potential of the bullish falling wedge pattern could see the BNB/USD pair testing towards the July 2019 swing-high, around the $40.00 level.
According to the latest sentiment data from TheTIE.io, the short-term sentiment towards Binance Coin is bearish, at 37.50 %, while the overall long-term sentiment towards the cryptocurrency is also bearish, at 39.00%.
Upside Potential
The four-hour time frame shows that key technical resistance is located at the $19.50 and $20.10 levels. Buyers need to rally price above the $23.50 level to move price above the neckline of a large inverted head and shoulders pattern.
Key technical resistance above the current monthly trading high is found at the $27.00 and $29.50 levels.
Downside Potential
The four-hour time frame is showing that the BNB/USD pair has strong short-term technical support around the $17.50 and $16.20 levels.
Key medium-term technical support for the BNB/USD pair is located at the $15.00 and $14.00 levels.
Summary
Binance Coin buyers need to rally price back above the $20.00 level to stabilize the cryptocurrency to avoid a deeper decline towards the October 2019 low.
Overall, the bullish inverted head and shoulders pattern on the four-hour time frame suggests that the BNB/USD pair could rally back towards the $23.00 level over the medium-term.