Binance Coin Price Analysis BNB / USD: Upbeat
BNB remains the utility token to beat...

Share this article
- Binance Coin (BNB) remains bearish over the short and the medium-term horizon
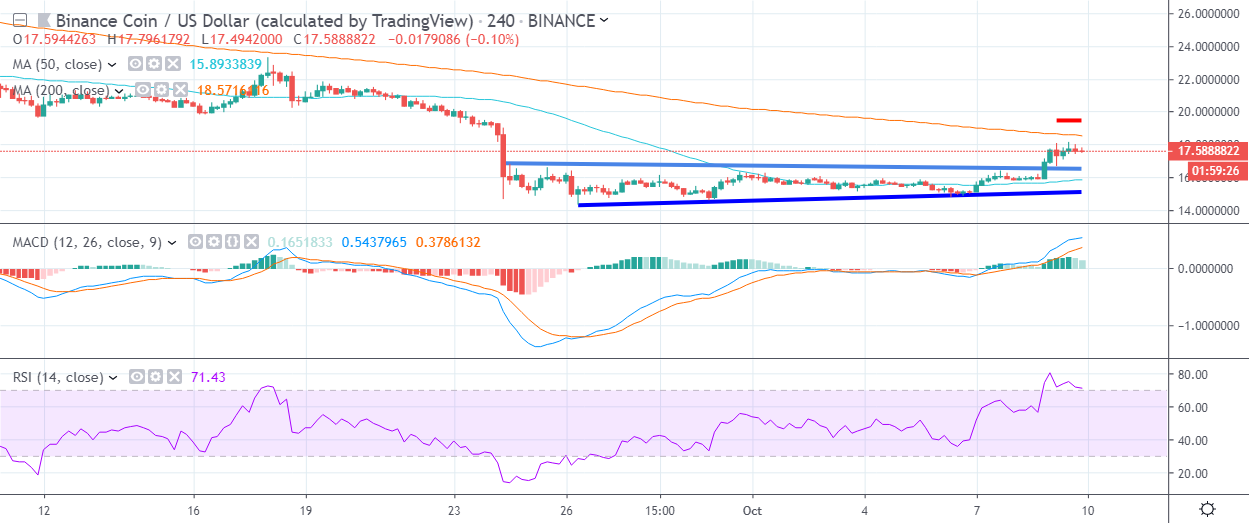
- The four-hour time shows that a bullish breakout has occurred from an ascending triangle pattern
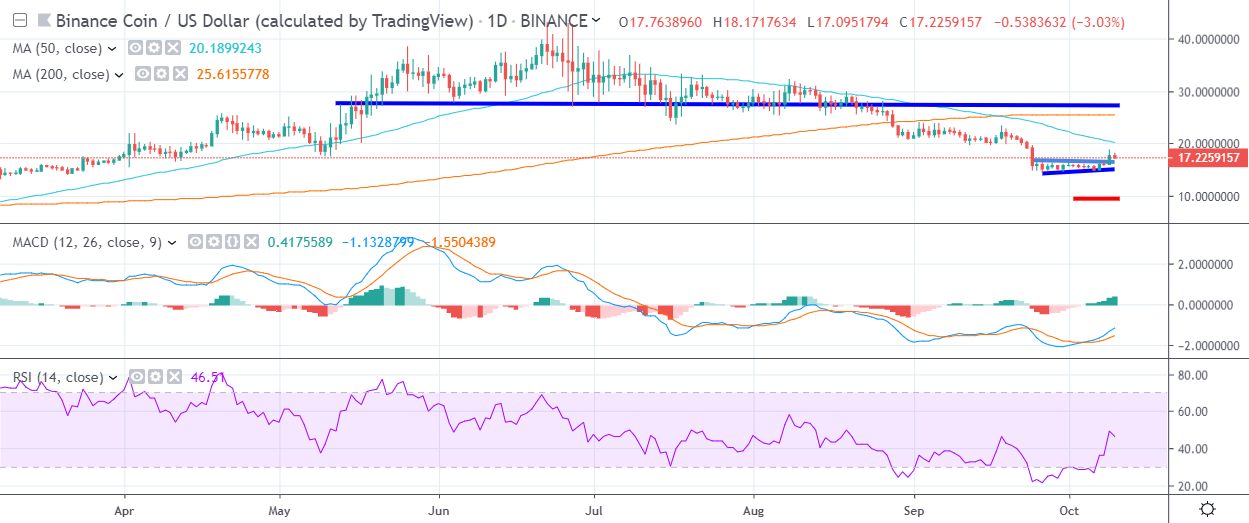
- A bearish death-cross is still underway on the daily time frame
Binance Coin is on the rise, after the cryptocurrency staged a powerful double-digit rally alongside the recent recovery in the broader cryptocurrency market.
The BNB / USD pair is now trading at its highest level since September 24th this year, with the cryptocurrency adding around twenty percent to its value since the October monthly price open.
The recent bounce in Binance Coin has done little to recover the summer losses the cryptocurrency incurred, after the eighth-largest cryptocurrency by market capitalization eroded around sixty five percent of its value from June 27th until September 26th.
The cryptocurrency is also still bearish over the short and medium term and remains in a precarious technical position while trading under the $20.00 level, due to the death-cross in play across the daily time frame.
The four-hour time frame shows that an ascending triangle pattern has been ignited, with the bullish pattern already reaching its overall upside objective. Key upcoming technical resistance is found at the $18.50 and $19.50 levels.
The daily time frame highlights that a bearish head and shoulders pattern is still in play, with the overall downside projection of the pattern located around the $10.00 level. Buyers will need to move price above the $28.00 level to move price above the neckline of the pattern.
The BNB / USD pair’s 50-day moving average is located around the $20.00 level and remains a key technical area medium-term bulls must reclaim to maintain the recent bullish momentum.
According to the latest sentiment data from TheTIE.io, the short-term sentiment towards Binance Coin is overwhelmingly bullish, at 75.50 %, while the overall long-term sentiment towards the cryptocurrency is neutral, at 52.00%.
Upside Potential
The four-hour time frame highlights that the BNB / USD pair has yet to reclaim its short-term bullish status. The 200-period moving average on the mentioned time frame is now located at the $18.50 level.
The daily time frame highlights the $20.00 and $28.00 levels as the major upcoming resistance levels that BNB / USD buyers need to break to secure the cryptocurrencies medium-term prospects.
Downside Potential
The four-hour time frame is showing that major short-term support for the BNB / USD pair is located at the $16.50 and $15.20 levels.
The daily time frame is still highlighting the $10.00 level as the overall medium-term bearish target. A break below the $14.00 level could trigger the decline.
Summary
Binance Coin is posting impressive double-digit gains from its monthly opening price, as the cryptocurrency attempts to break its four-month losing streak.
BNB / USD buyers need to anchor price above the $28.00 level to secure the cryptocurrency’s medium-term prospects.
Check out our coin guide for BNB to understand how it works.
We also conducted a deep analysis of the Binance Token in an update yesterday by our SIMETRI Research team.
Share this article
