
Binance Coin Party winding down
Binance Coin / USD Technical Analysis: Party Is Winding Down
BNB / USD Technical Analysis - Binance Coin is looking bullish in the very short term, but it seems that this won't last for too long.
[vc_row][vc_column][vc_column_text]
- Binance Coin is bullish in the short-term with the pair testing towards important technical highs
- Caution is warranted as bearish divergence is building on the four-hour time frame
- Medium-term picture is bullish, although some technical indicators appear overstretched
Binance Coin / USD Short-term price analysis
In the short-term, Binance Coin is bullish with the popular coin enjoying strong buying demand since the start of this month. The BNB / USD pair is trading well above all key moving averages, with the 50-period moving average crossing over the 200-period moving average.
Warning signs are starting to emerge that a technical pullback may occur, as the BNB / USD pair is showing bearish MACD divergence on the four-hour time frame.
Aside from the bearish price divergence, the Relative Strength Index and Stochastic indicator have both reached extreme oversold conditions on the mentioned time frame.
Pattern Watch
The four-hour time frame highlights the recently triggered bullish inverted head and shoulders pattern, which has already reached its upside projection.
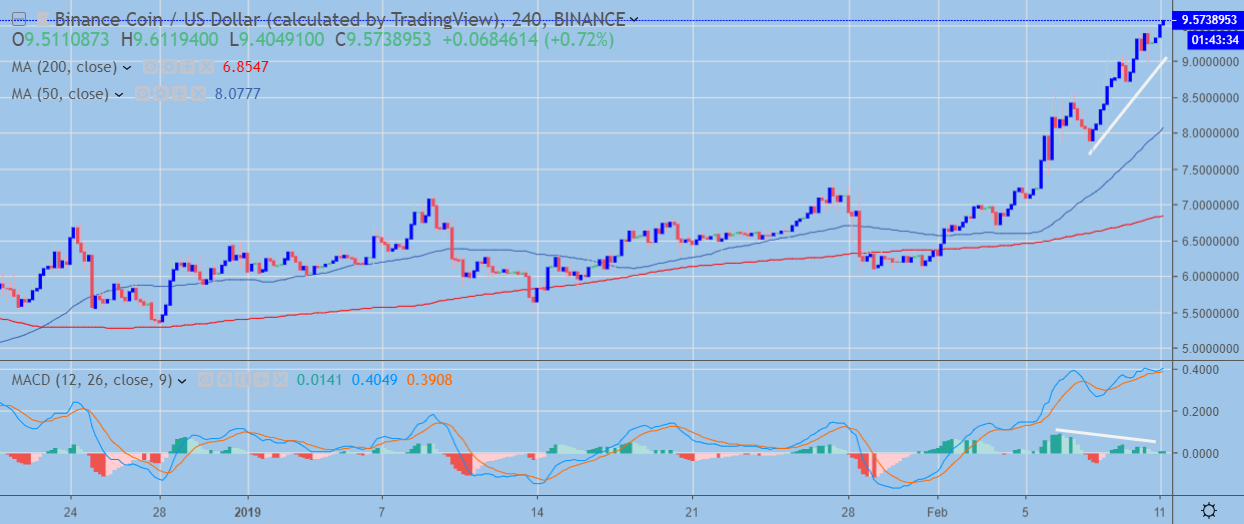 BNB / USD H4 Chart (Source: TradingView)
MACD
The MACD indicator is creating bearish divergence, which is signaling a possible near-term correction lower.
Binance Coin / USD Medium-term price analysis
Binance Coin is bullish in the medium-term, with the cryptocurrency staging a bullish rally above its 200-day moving average. Given that the BNB / USD pair has traded below its 200-day since August of last year, the recent breakout is a major technical development.
The BNB / USD pair has two immediate targets, firstly, the November 7th 2018 swing-high and the September 2nd 2018 trading high, which is the more bullish of the two potential targets.
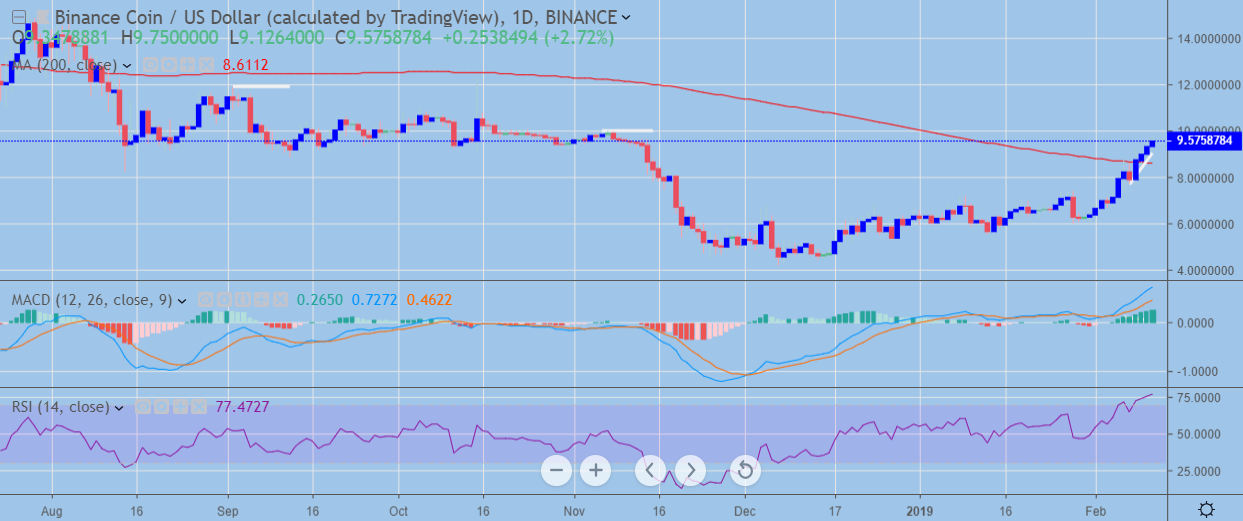 BNB / USD H4 Chart (Source: TradingView)
Pattern Watch
Traders should watch for the formation of a bullish inverted head and shoulders pattern on the daily time frame, particularly if the September 2nd trading high is reached.
MACD Indicator
The MACD indicator on the daily time frame time is bullish and shows no bearish divergence at present.
RSI Indicator
The Relative Strength Index is bullish on the daily time frame, although caution is advised as the indicator has approached oversold conditions.
Conclusion
Binance Coin is bullish over the medium-term and is one of the few major cryptocurrencies trading back above its 200-day moving average.
A short-term technical correction may occur due to the creation of bearish divergence on the four-hour frame. Traders should also watch for the potential formation of a large inverted head and shoulders pattern on the daily time frame.
Decentral Media, Inc., the publisher of Crypto Briefing, is not an investment advisor and does not offer or provide investment advice or other financial advice. Nothing on this website constitutes, or should be relied on as, investment advice or financial advice of any kind. Specifically, none of the information on this website constitutes, or should be relied on as, a suggestion, offer, or other solicitation to engage in, or refrain from engaging in, any purchase, sale, or any other any investment-related activity with respect to any transaction. You should never make an investment decision on an investment based solely on the information on our website, and you should never interpret or otherwise rely on any of the information on this website as investment advice. We strongly recommend that you consult a licensed investment advisor or other qualified financial professional if you are seeking investment advice on an investment.
[/vc_column_text][/vc_column][/vc_row]