
Shutterstock photo by Morrowind
Bitcoin and Ethereum Fundamentals Look Strong While Technicals Spell Trouble
The two largest cryptocurrencies by market capitalization sit at a pivotal point.
Bitcoin and Ethereum show ambiguity from a technical perspective, despite rising interest behind these cryptocurrencies.
Bitcoin Whales Go Into Buying Frenzy
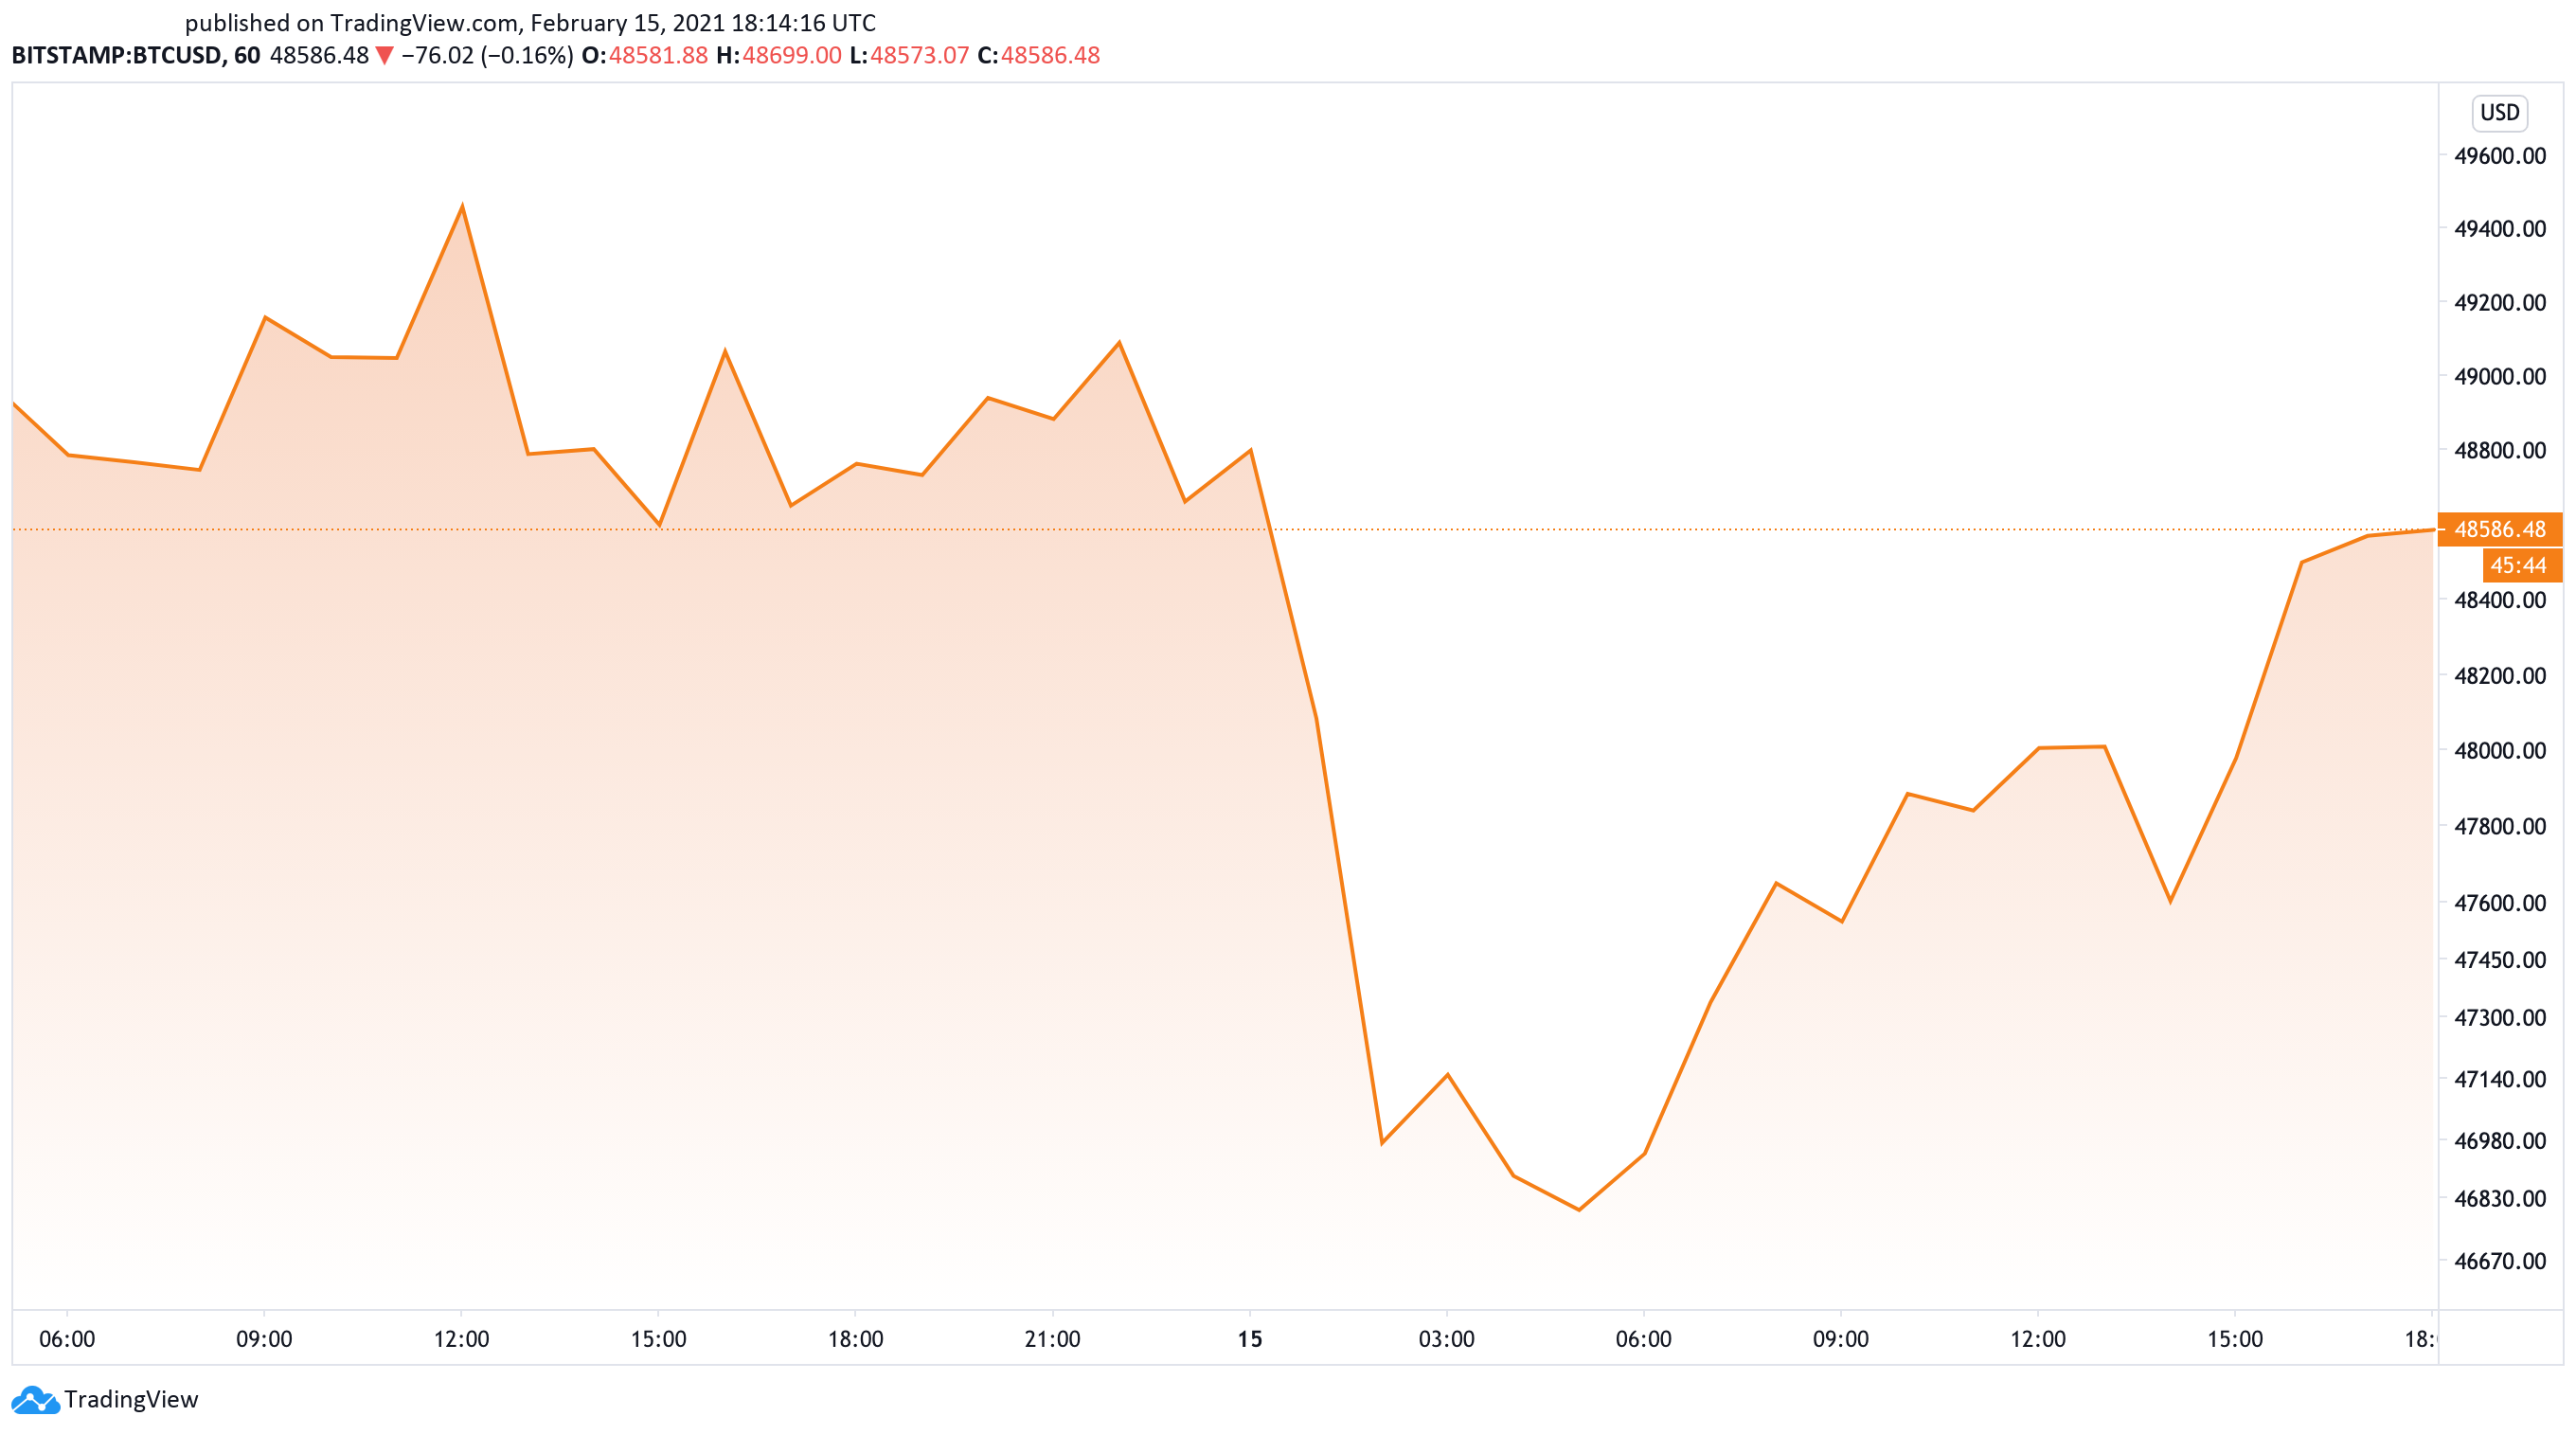
Overleveraged traders are getting crushed as Bitcoin becomes more volatile over time. After reaching a new all-time high of $49,700 on Feb. 14, BTC took an 8% nosedive a few hours later.
The sudden downswing to $45,350 generated more than $1.90 billion in liquidations across the board.
Despite the massive losses incurred within such a short period, sidelined investors took advantage of the downward price action to get back into the market. The spike in bullish momentum allowed Bitcoin to quickly regain the $48,000 level as support.
When considering the rate at which whales have been adding more tokens to their portfolios, the optimistic narrative holds.
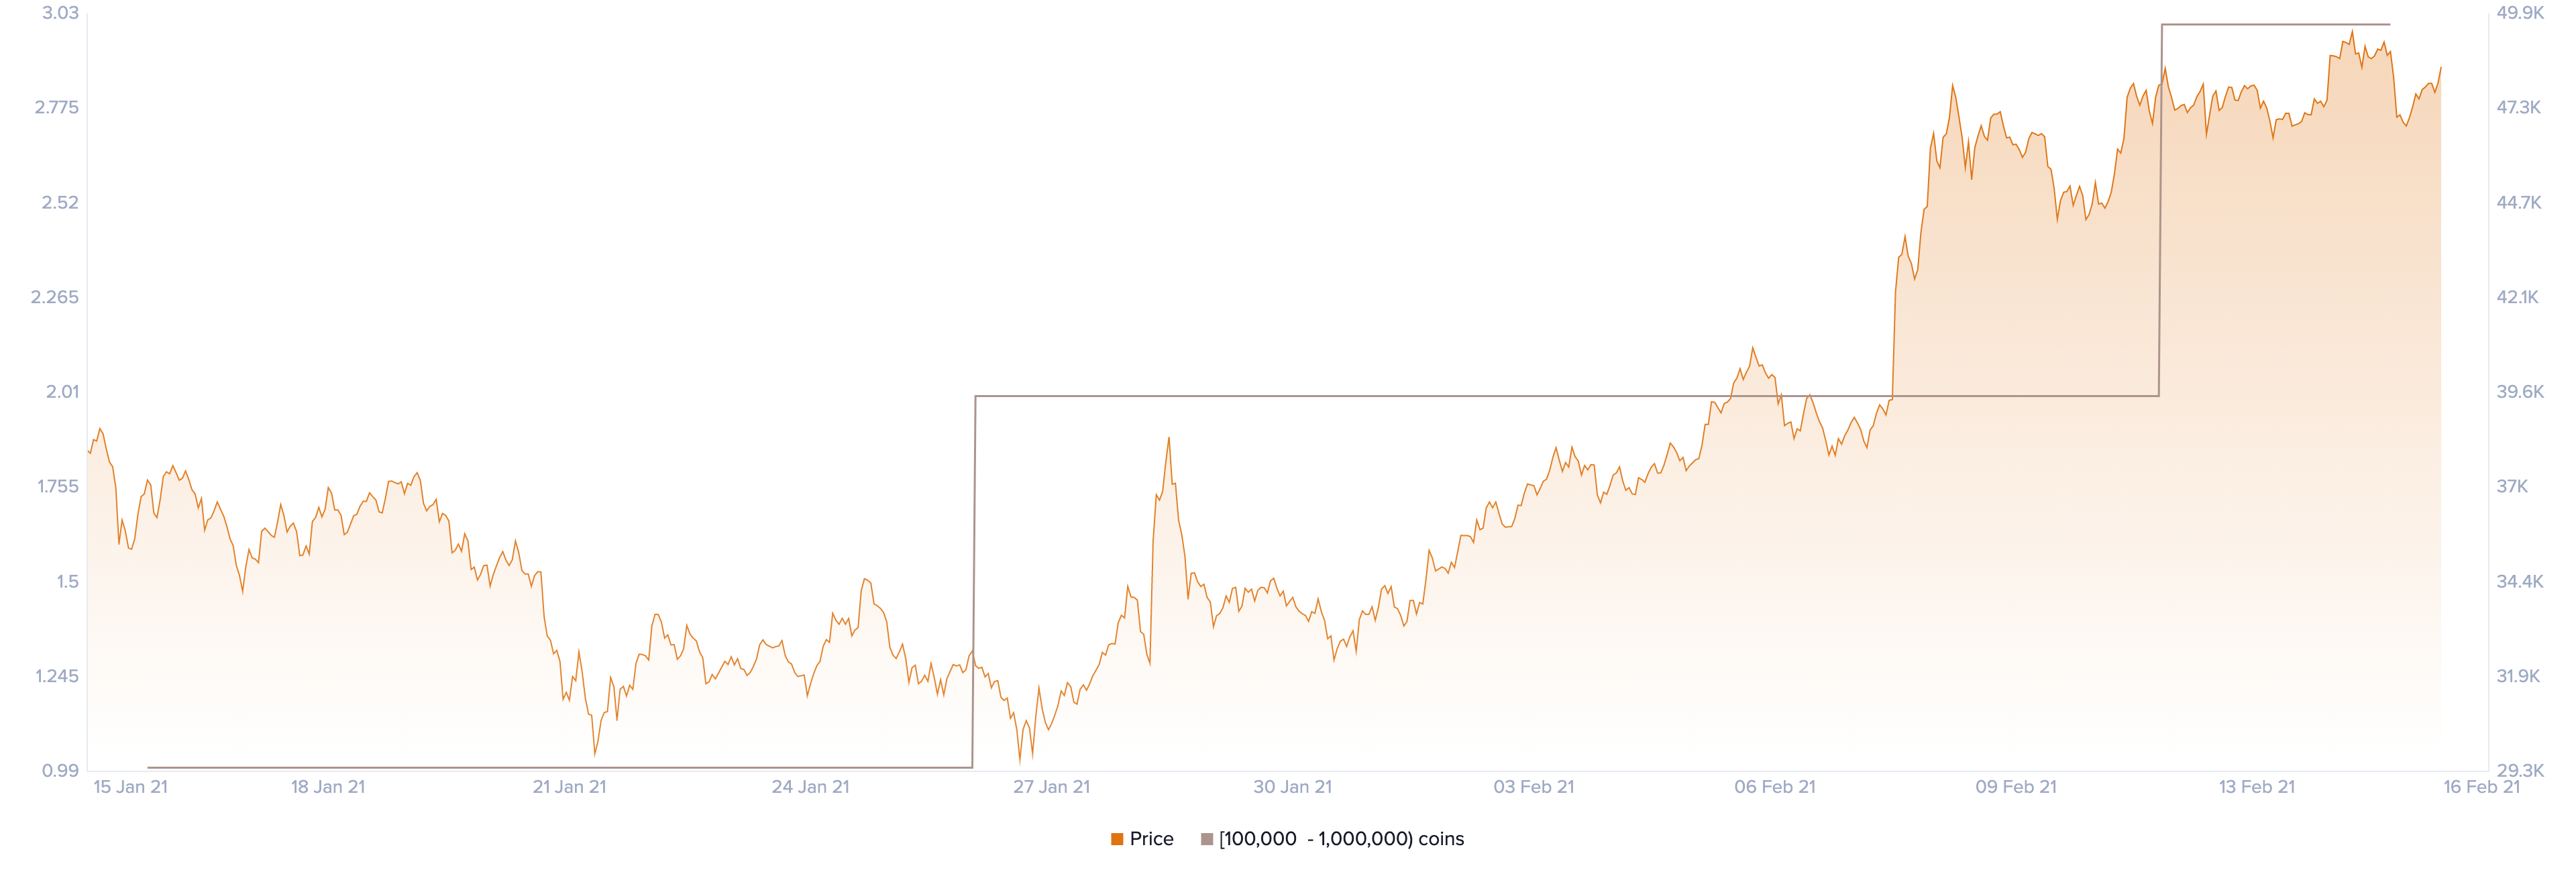
Santiment’s holder distribution chart shows that the buying pressure behind Bitcoin has risen dramatically over the past three weeks. The behavioral analytics firm recorded a significant spike in the number of addresses holding 100,000 to 1,000,000 BTC.
Roughly two new whales with $4.80 billion to $48 billion worth of Bitcoin have joined the network, representing a 200% increase.
While buy orders continue to pile up behind Bitcoin, the technicals spell trouble. For instance, the Tom Demark (TD) Sequential indicator presented a sell signal on BTC’s daily chart. The bearish formation developed as a green nine candlestick, anticipating a one to four 1-day candlesticks correction.
The Relative Strength Index (RSI) also suggests that Bitcoin is primed to retrace because it sits overbought territory. This momentum indicator created a bearish divergence as it made a series of lower highs, while BTC’s price created a series of higher highs.
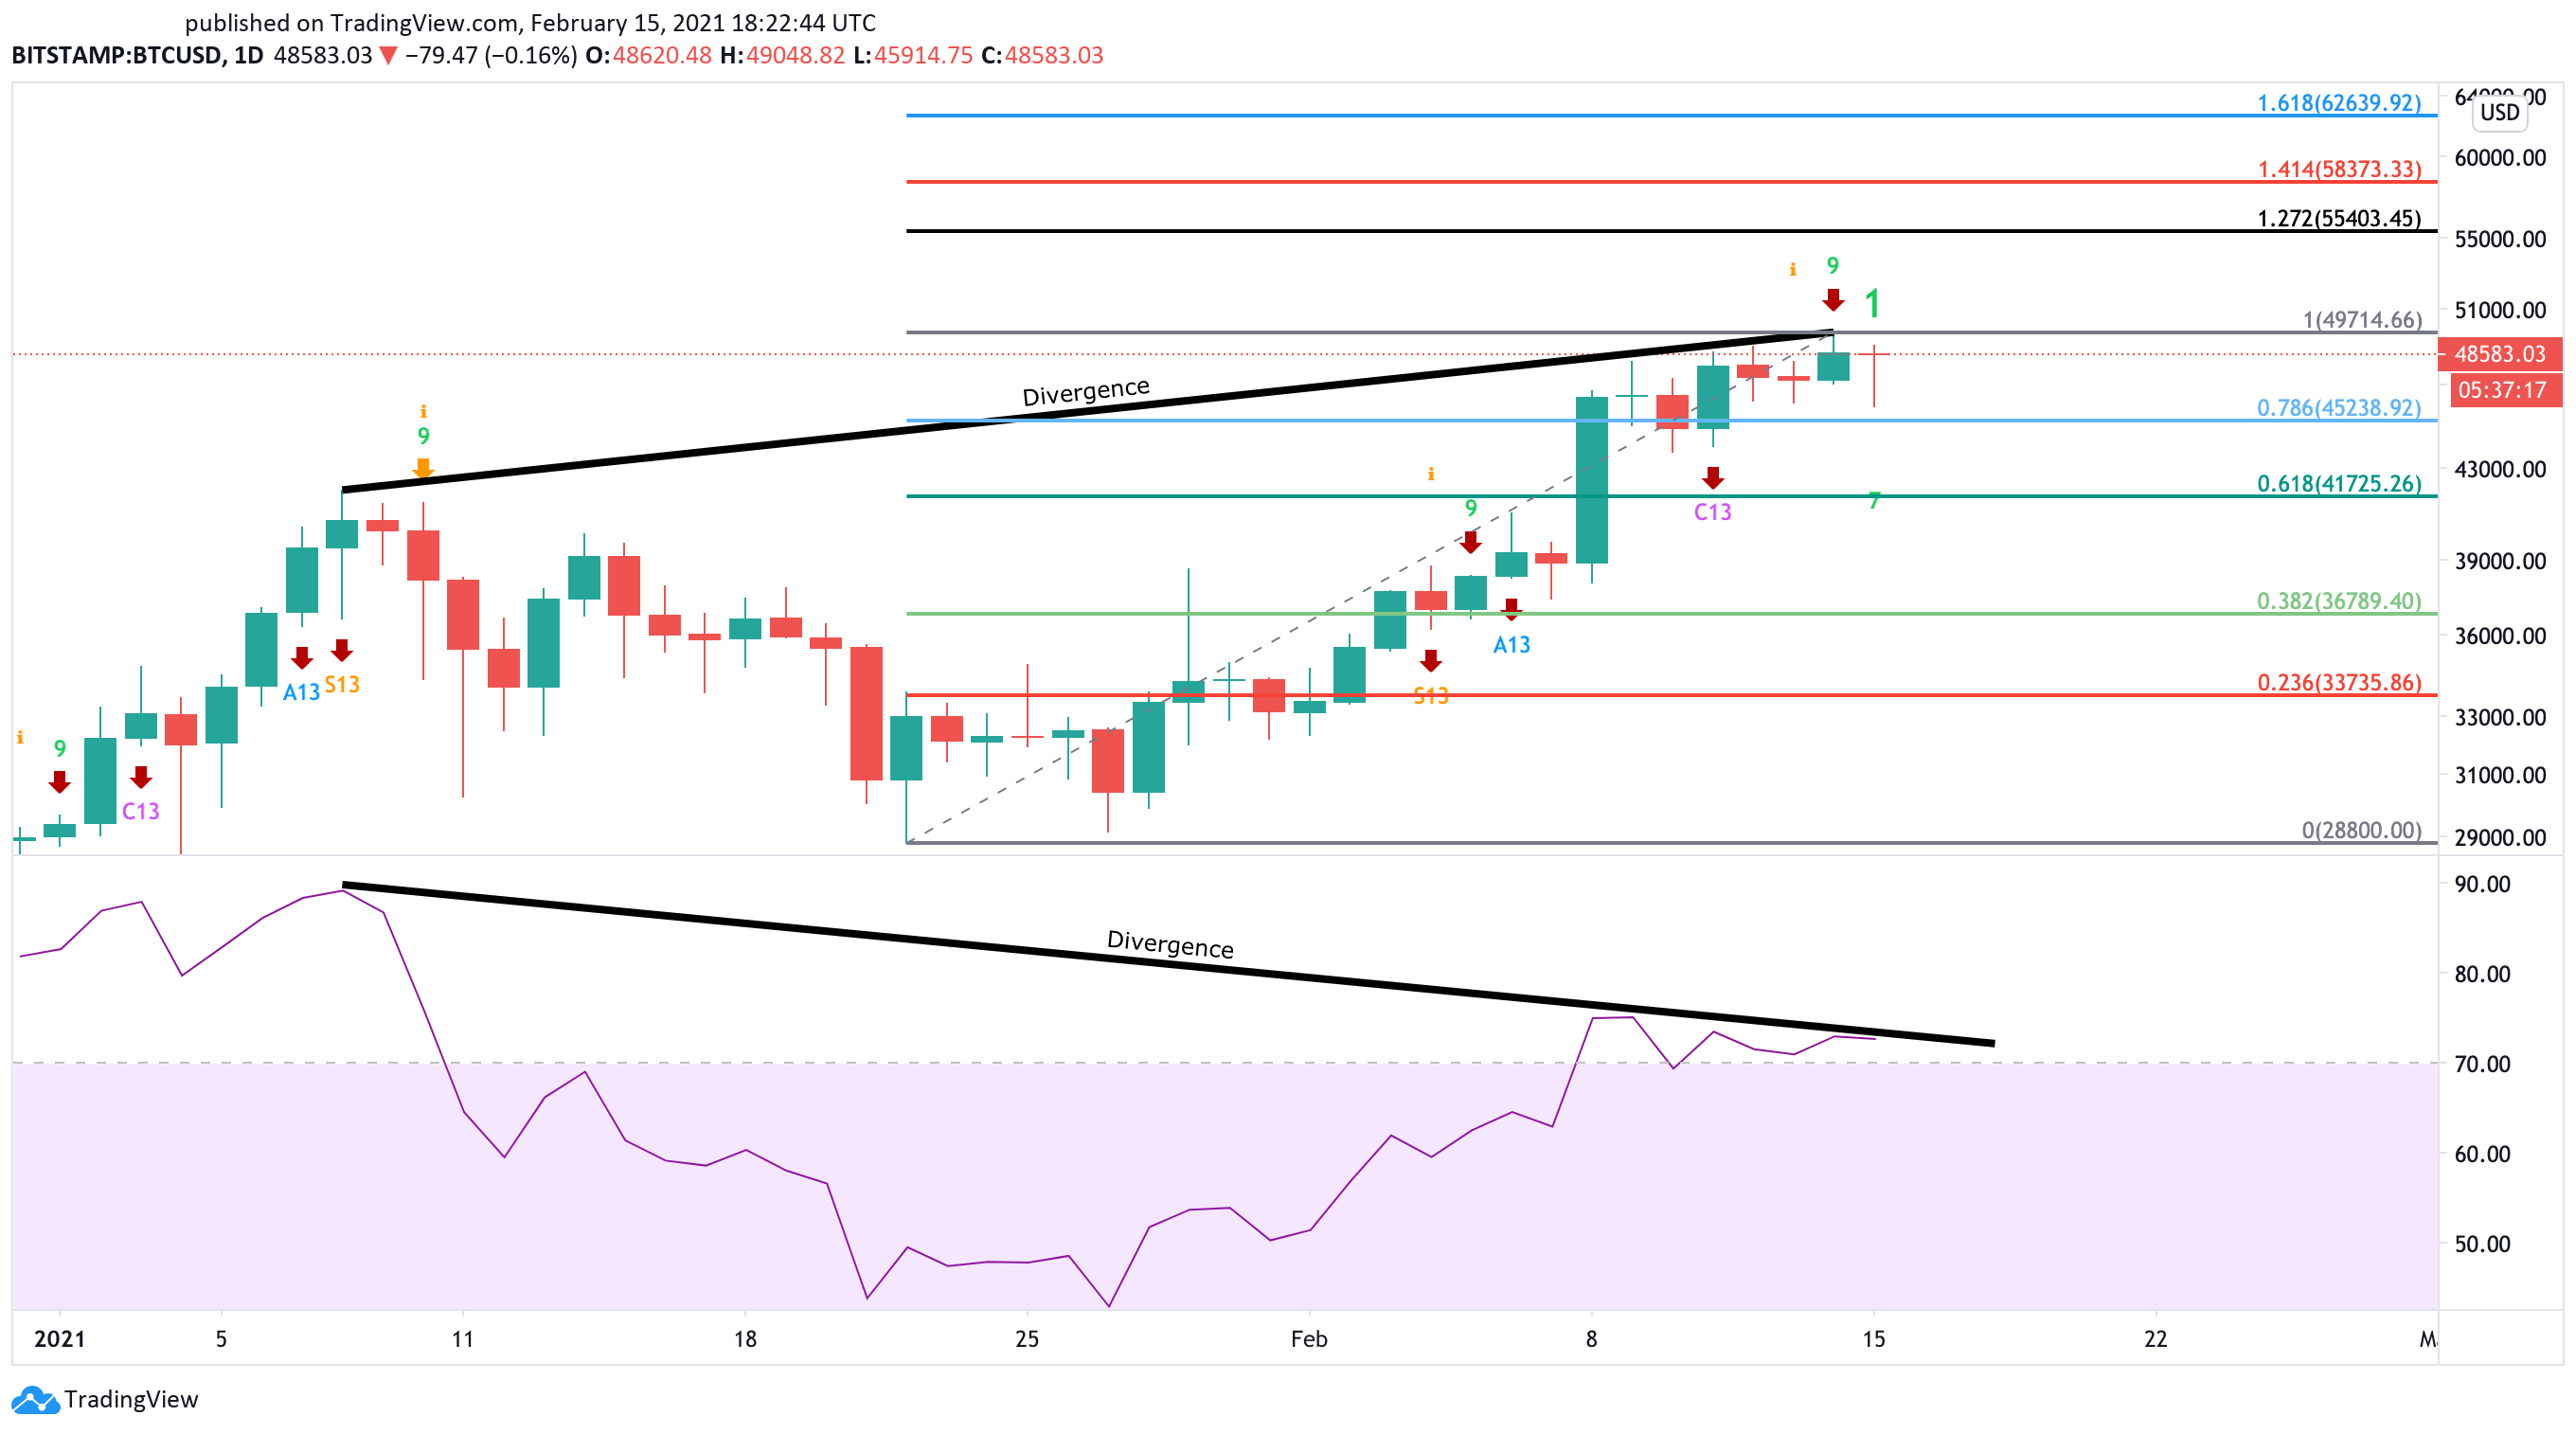
Given the ambiguity that Bitcoin presents, the recent high of $49,700 and the 78.6% Fibonacci retracement level are the most critical resistance and support points to watch.
A daily candlestick close above or below this trading range will determine where BTC is headed next. While bulls target $63,000 upon the break of the overhead resistance barrier, the bears will likely aim for $40,000 if the $45,000 support level fails to hold.
Ethereum Sits on Top of a Demand Barrier
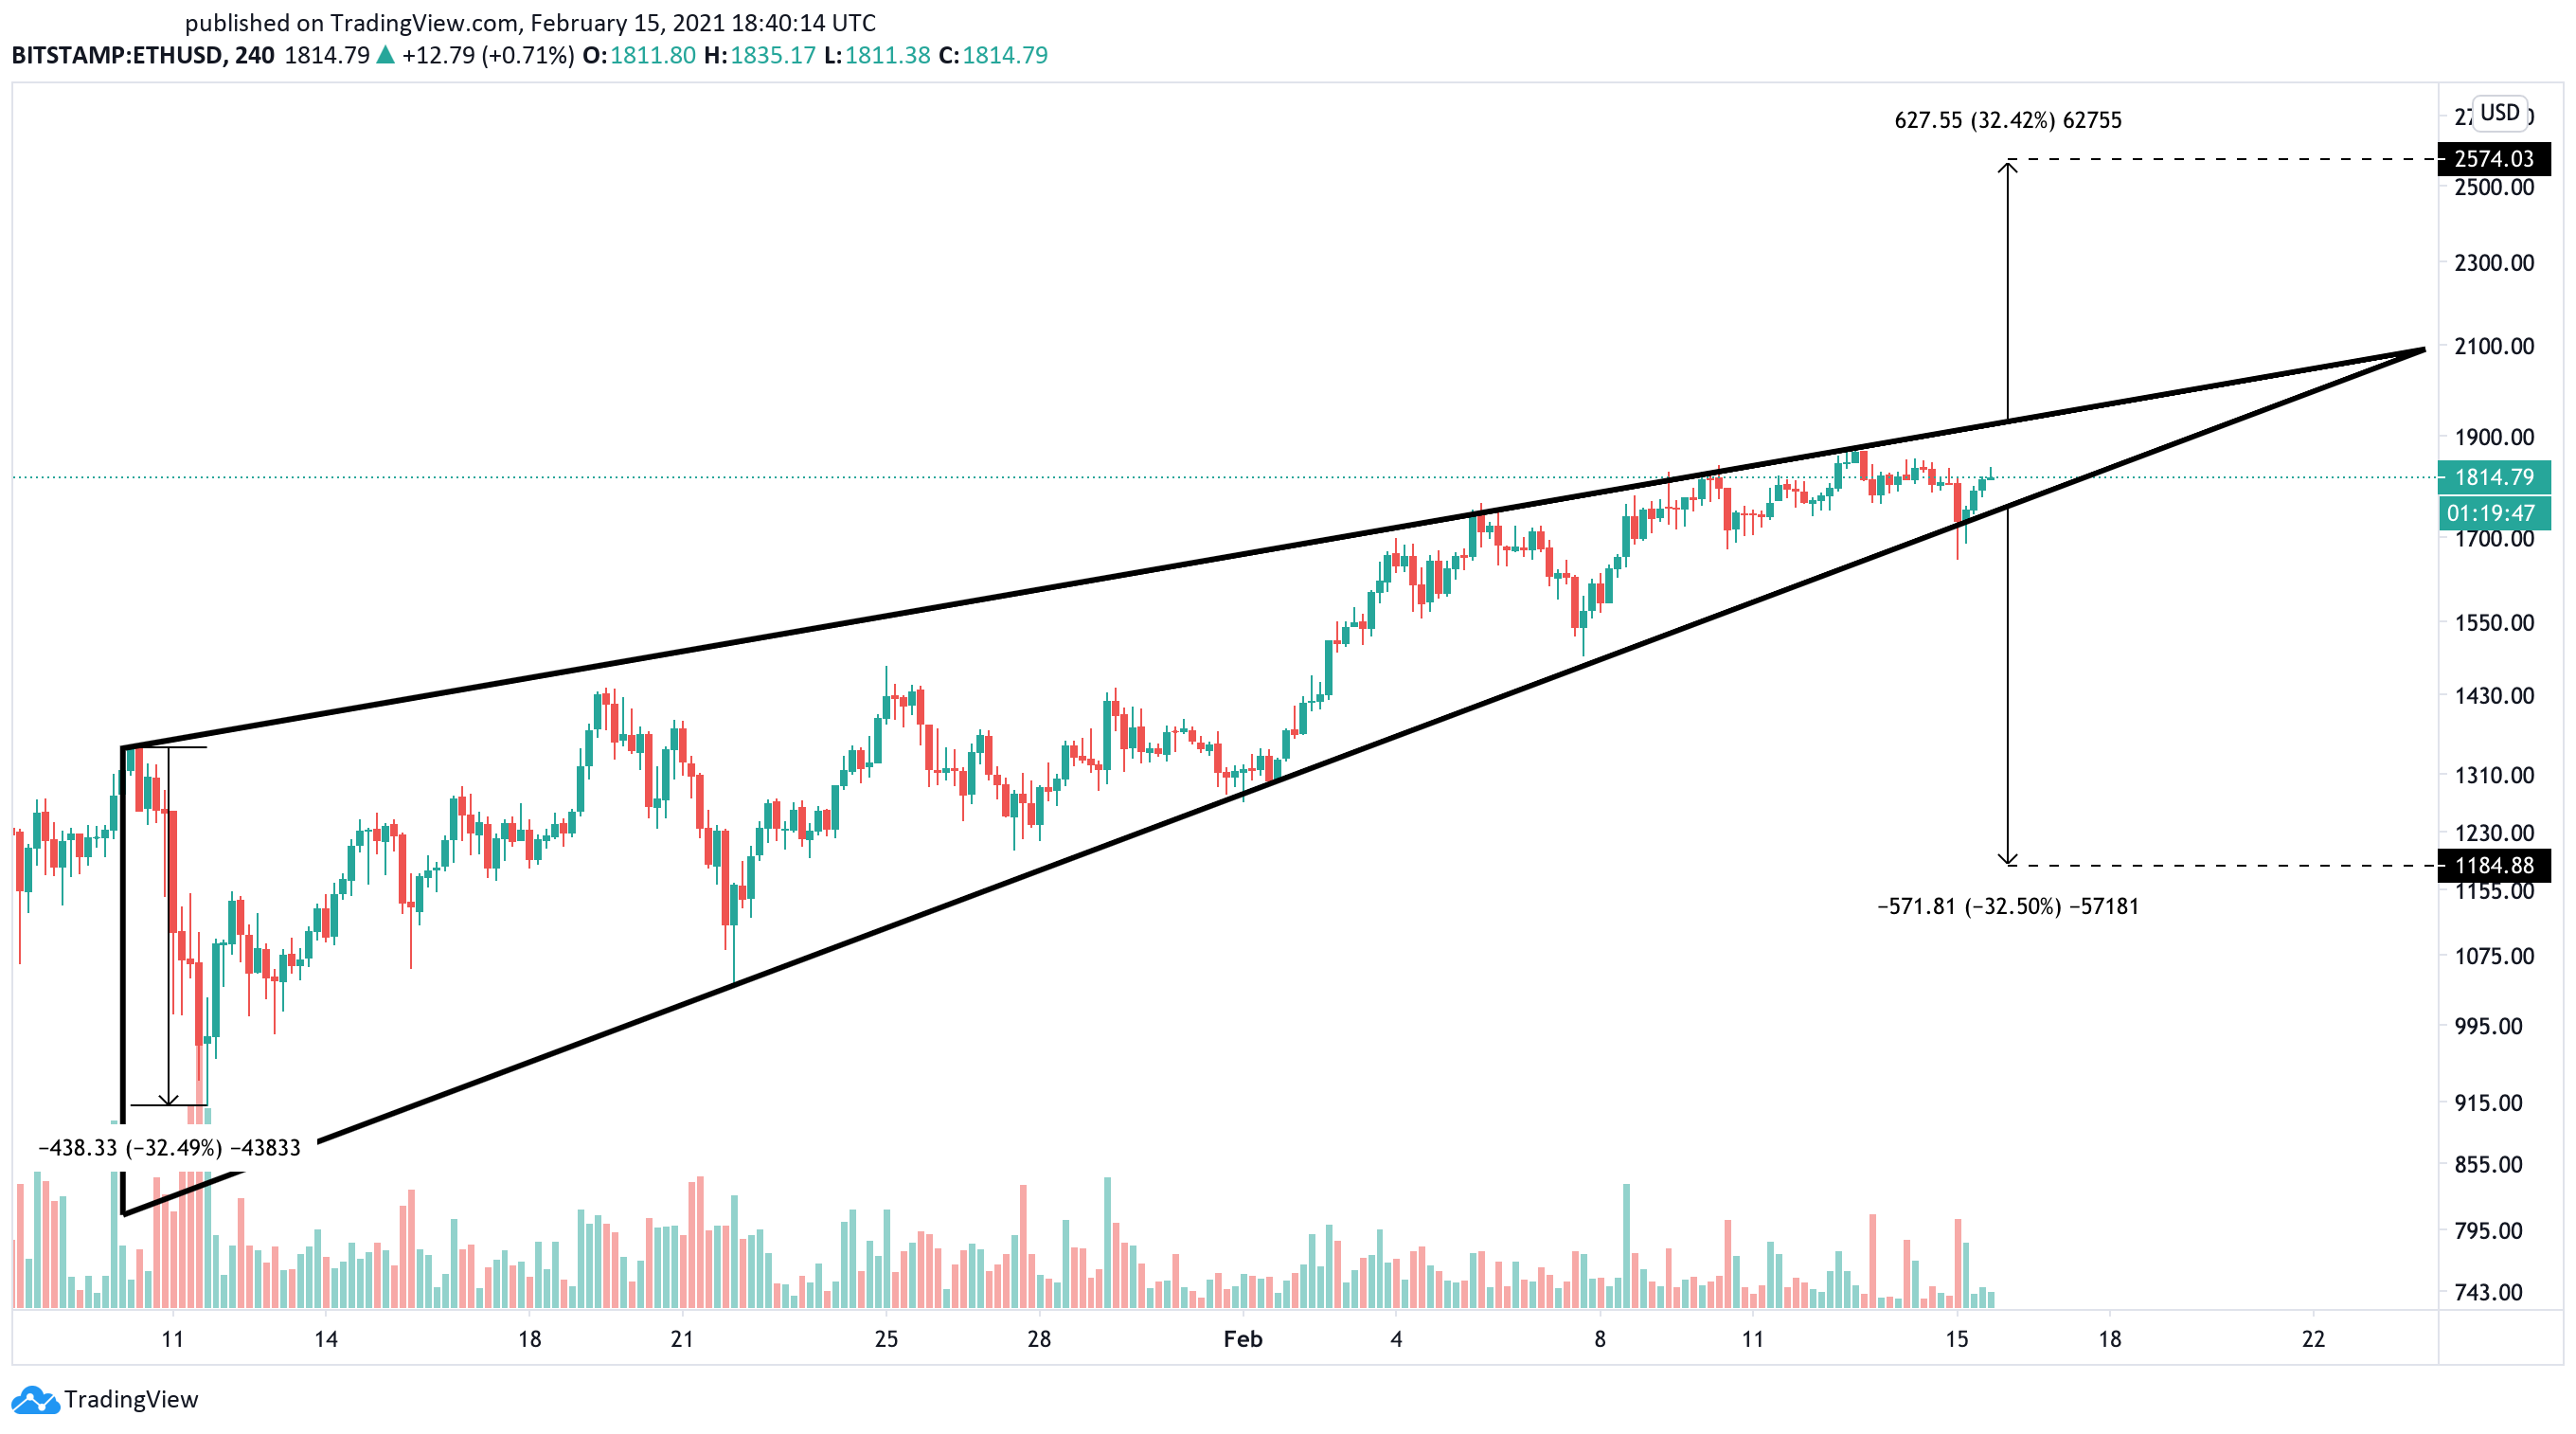
Ethereum has enjoyed a slow but steady uptrend since mid-January that saw it reach a new all-time high of $1,875. The price action appears to have created a rising wedge within ETH’s 4-hour chart.
One trend line can be drawn around the swing highs while another seems to join the swing lows.
This technical pattern usually signals a price reversal. Therefore, an increase in the selling pressure that pushes Ethereum below the wedge’s lower boundary could be catastrophic since it may lead to a 32.5% correction. ETH might take a nosedive towards $1,200 before the uptrend resumes.
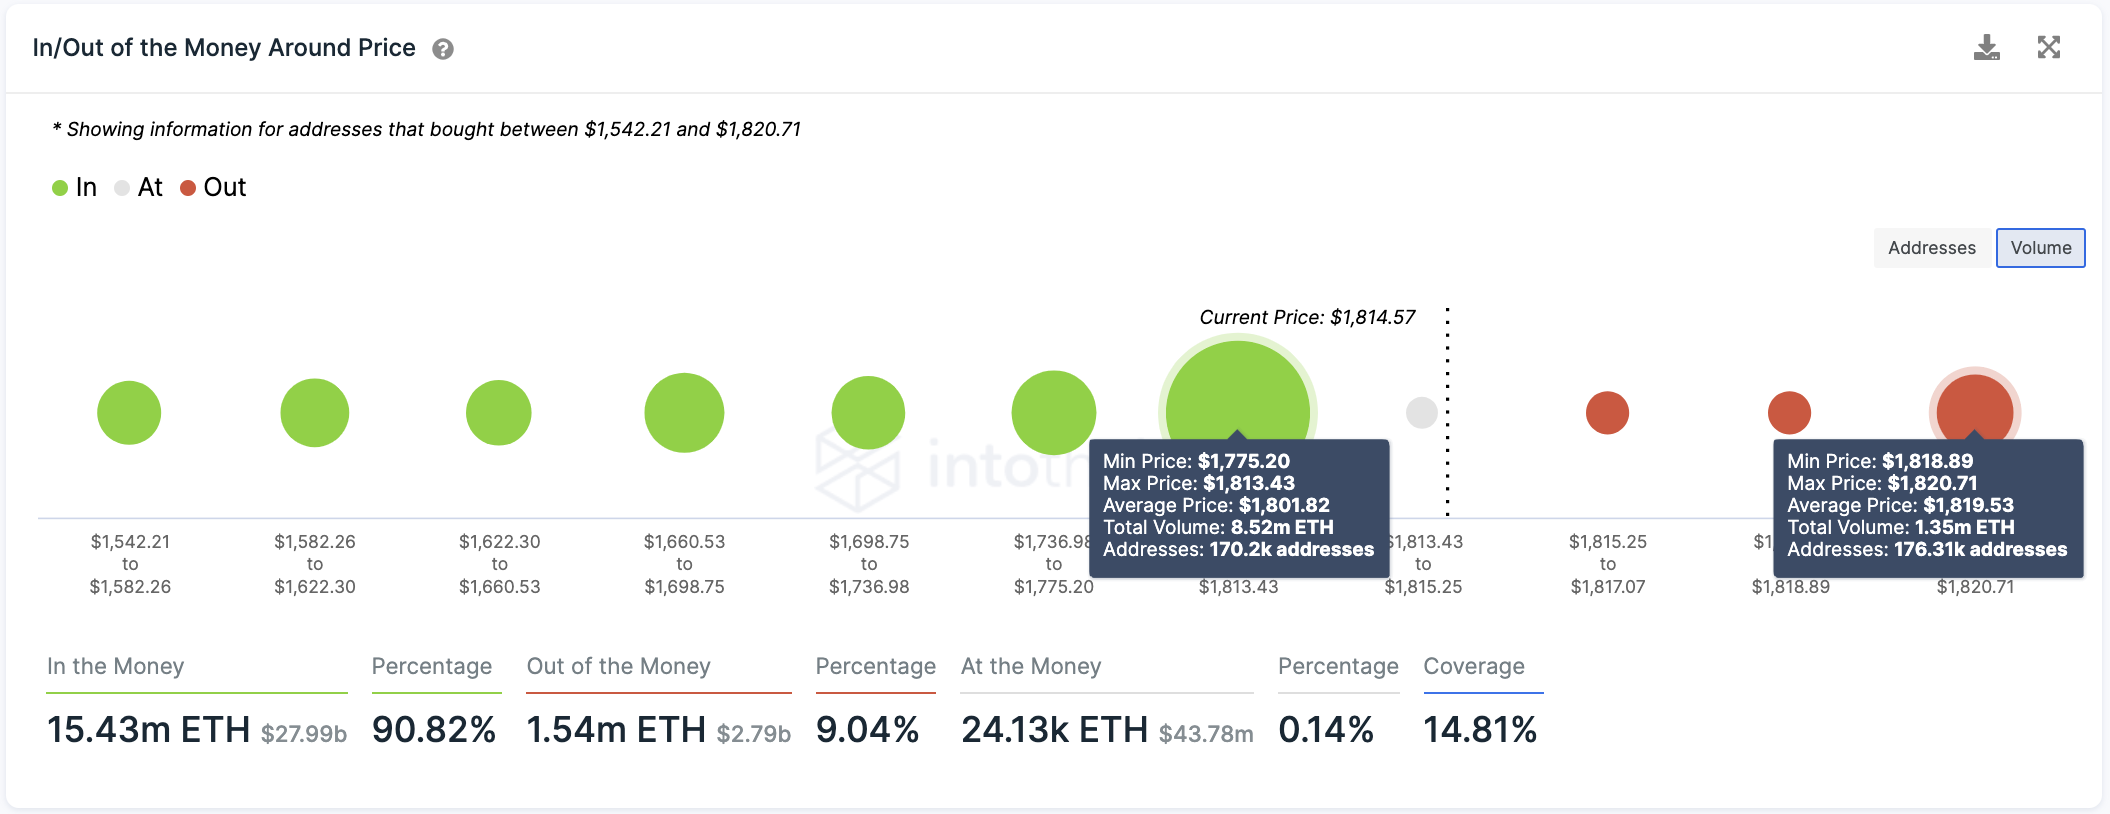
Nonetheless, IntoTheBlock’s In/Out of the Money Around Price (IOMAP) model reveals Ethereum sits on top of a massive demand barrier that will not be easy to break. Over 170,000 addresses bought more than 8.50 million ETH between $1,775 and $1,815.
Further price deprecation may prove challenging since holders within this price range will do anything to keep their positions “In the Money.” They may even buy more tokens in the event of a downswing to allow Ether to rebound.
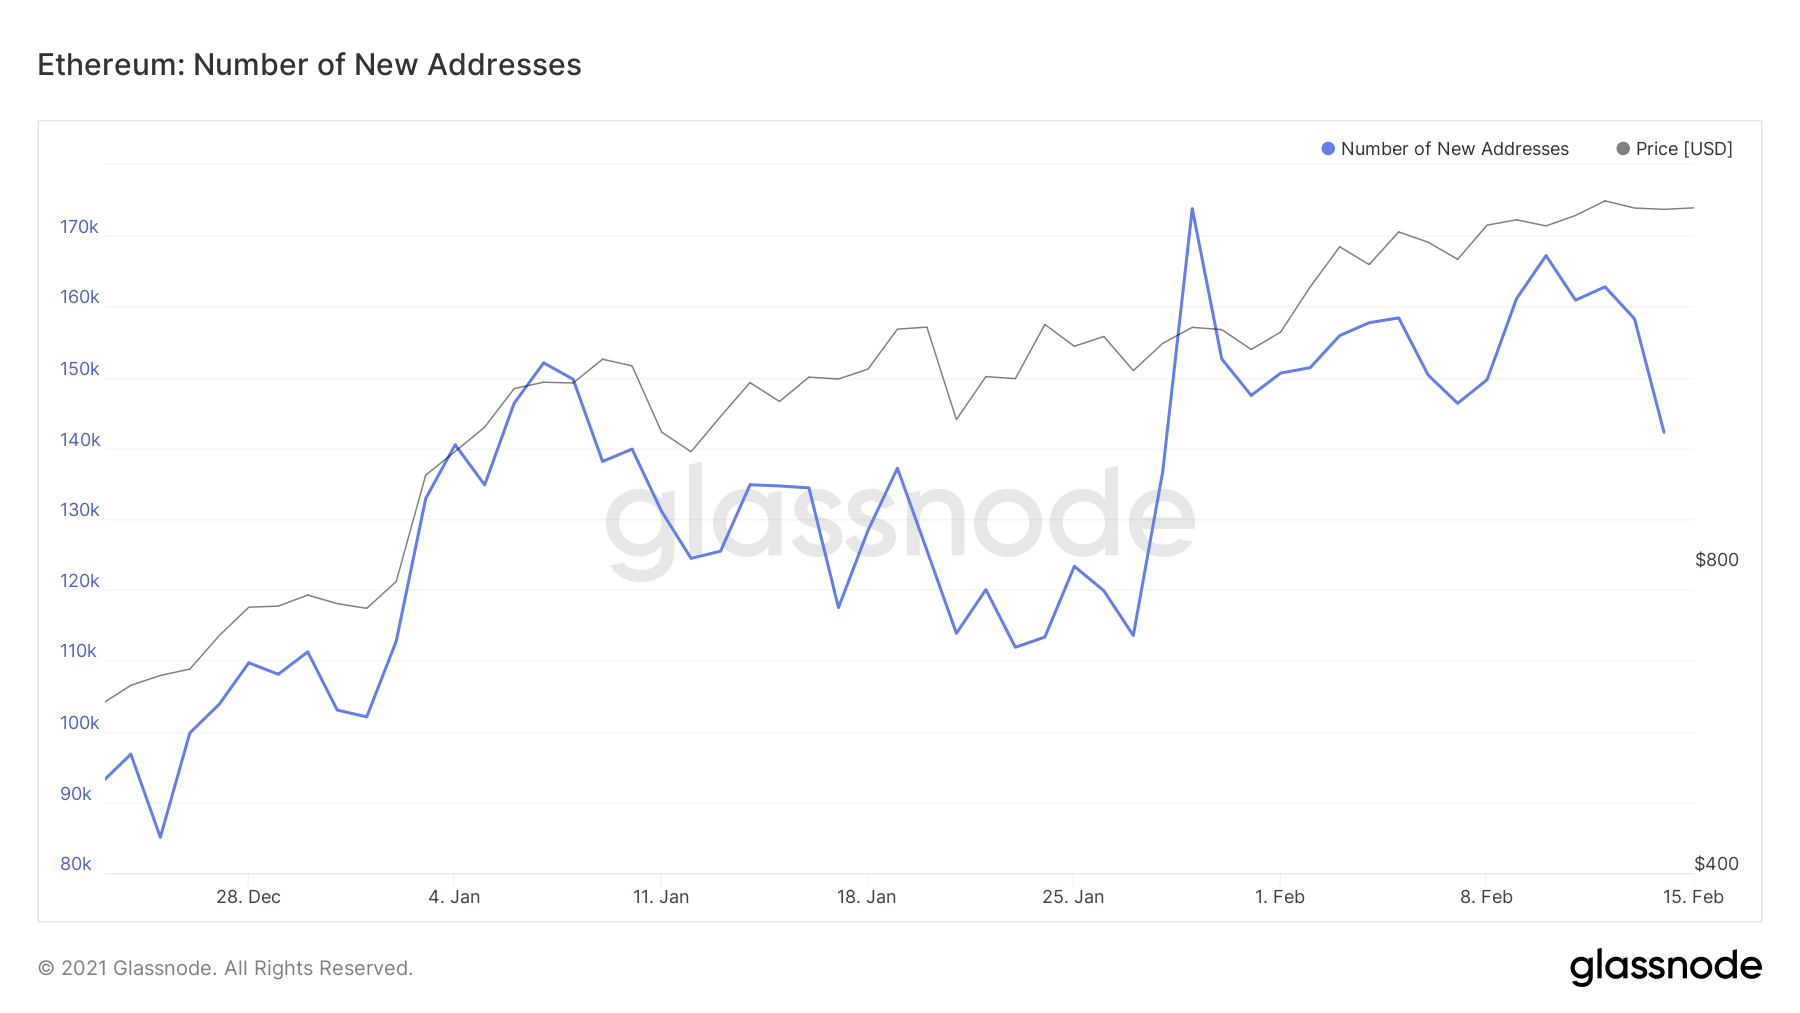
Moreover, the Ethereum network continues expanding, which favors bull investors. After bottoming out in late December 2020 at a low of 85,050 addresses per day, the network’s growth has skyrocketed. More than 142,000 new addresses are being created per day at press time, representing a 67% increase.
This network expansion can be considered a very optimistic signal because it is often regarded as one of the most accurate predictors of price. As such, the ongoing uptrend in user adoption may help ETH avoid a steep correction and instead march towards higher highs.
Due to the lack of resistance ahead, it is reasonable to assume that a 4-hour candlestick close above the recent high of $1,875 will drive the price of ETH towards $2,600. Under such circumstances, the rising wedge will be regarded as a continuation pattern.
But if the bulls fail to contain prices from slicing through the $1,800 support, a steep correction to $1,200 will be inevitable.
The Cryptocurrency Market Moves Forward
Despite the ambiguous outlook that Bitcoin and Ethereum show, some of the most prominent figures in the cryptocurrency industry believe that the bull market has just begun.
In a recent blog post, on-chain analyst Willy Woo stated that institutional investors have mainly driven the ongoing rally behind Bitcoin. Now, it seems like retail investors are trying to get a piece of the cryptocurrency before prices rise higher.
By identifying the number of unique addresses, Woo determined that 20,000 new addresses joined the Bitcoin network each day during the past five weeks. He stated that this is a “sure sign that retail investors are now coming in,” adding that those investors “typically start ramping up in numbers during the middle phases of bull markets.”
If the trend continues, Bitcoin may be able to invalidate the TD setup’s bearish outlook and aim for $63,000, bringing Ethereum up with it.
Disclosure: At the time of writing, this author owned Bitcoin and Ethereum.