
Shutterstock cover by Elpisterra
Bitcoin Bounces Back But Faces Stiff Resistance Ahead
Bitcoin has yet to regain a critical resistance level as support to mark the end of the recent corrective period.
Bitcoin is back in the green despite last week’s bearish shakeout. With new support found, BTC now looks like it could retest the $57,000 resistance level.
Bitcoin FUD Strikes Again
A new wave of fear, uncertainty, and doubt struck the cryptocurrency market after Bitcoin rose to a new all-time high of nearly $65,000 on Apr. 14. A power outage in Xinjiang, China that forced some Bitcoin miners to shut down, combined with U.S. President Joe Biden’s plans to double capital gains taxes, caused panic among investors.
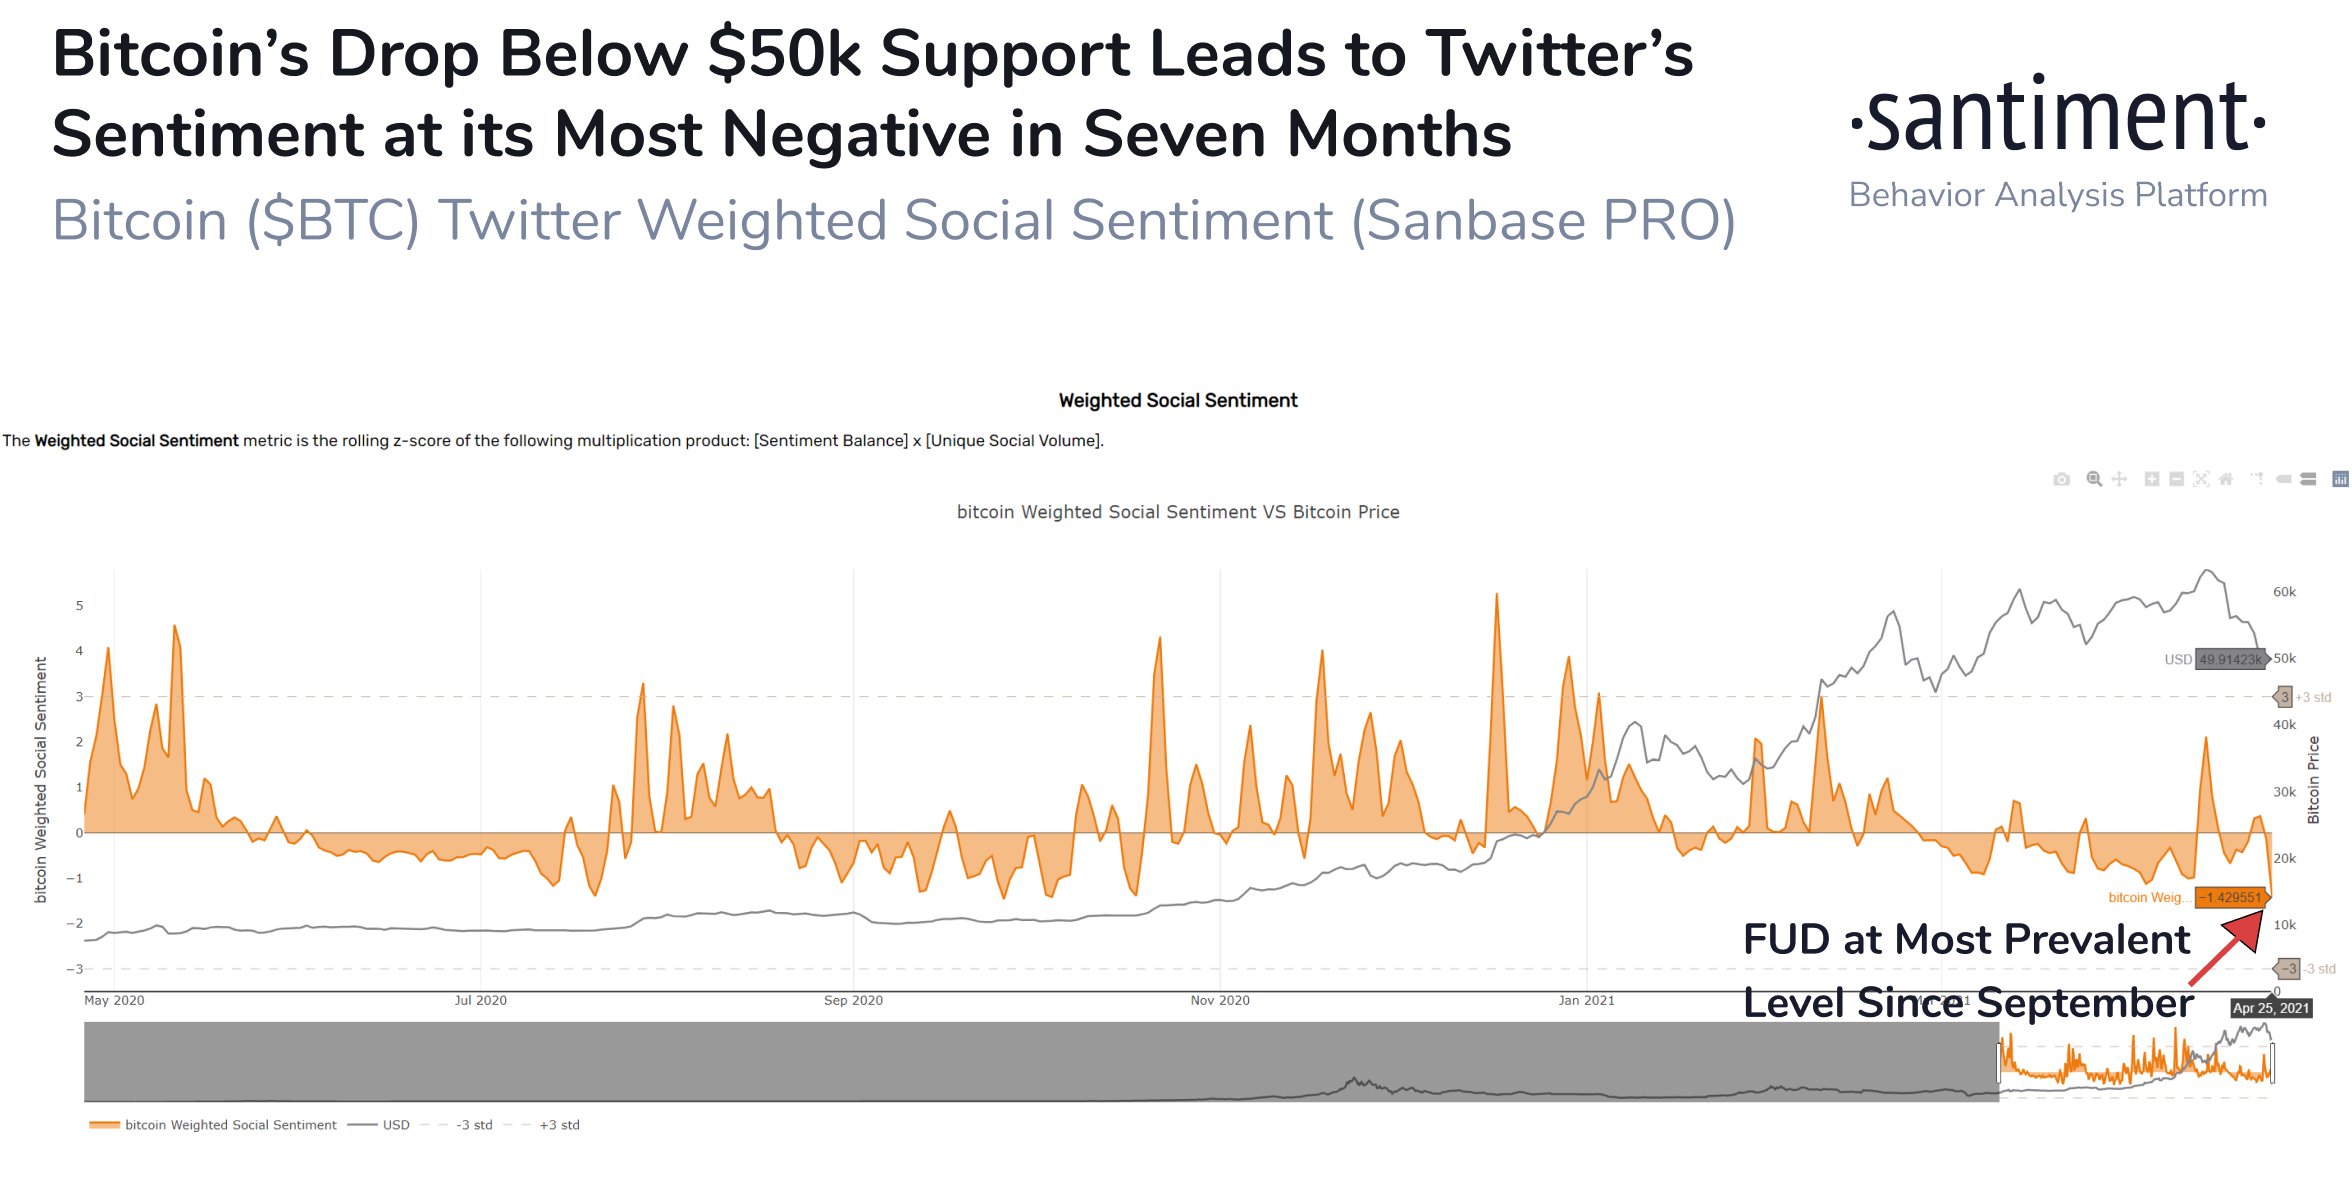
Santiment recorded the highest levels of pessimism in months as Bitcoin prices tumbled.
The behavioral analytics platform affirmed that “FUD had gripped” the cryptocurrency industry as market participants were at the “most fearful level” since Sept. 26.
Interestingly enough, Tether’s market capitalization surged by 10% to surpass the $50 billion mark while investors trembled with fear.
Such a bullish divergence between USDt’s market share and Bitcoin’s price is usually seen as a sign that the market is primed to rebound.
Leading Cryptocurrency Rebounds Strongly
BTC’s daily chart seems like these fundamental aspects aligned with several technical factors that helped kick prices off with a bang.
The 100-day moving average and the Tom DeMark (TD) Sequential’s setup trendline served as a demand barrier that prevented Bitcoin from dropping further. Meanwhile, the TD presented a buy signal in the form of a red nine candlestick, anticipating that BTC was bound for a bullish impulse.
Now that the flagship cryptocurrency has risen by more than 9% since Monday’s trading session began, it may have more room to go up.
The 50-day moving average at $56,850 is the only resistance barrier ahead that could impede Bitocin from resuming its uptrend.
Only a daily candlestick close about this trend-following indicator can serve as confirmation that the correction is over and BTC will reach higher highs.
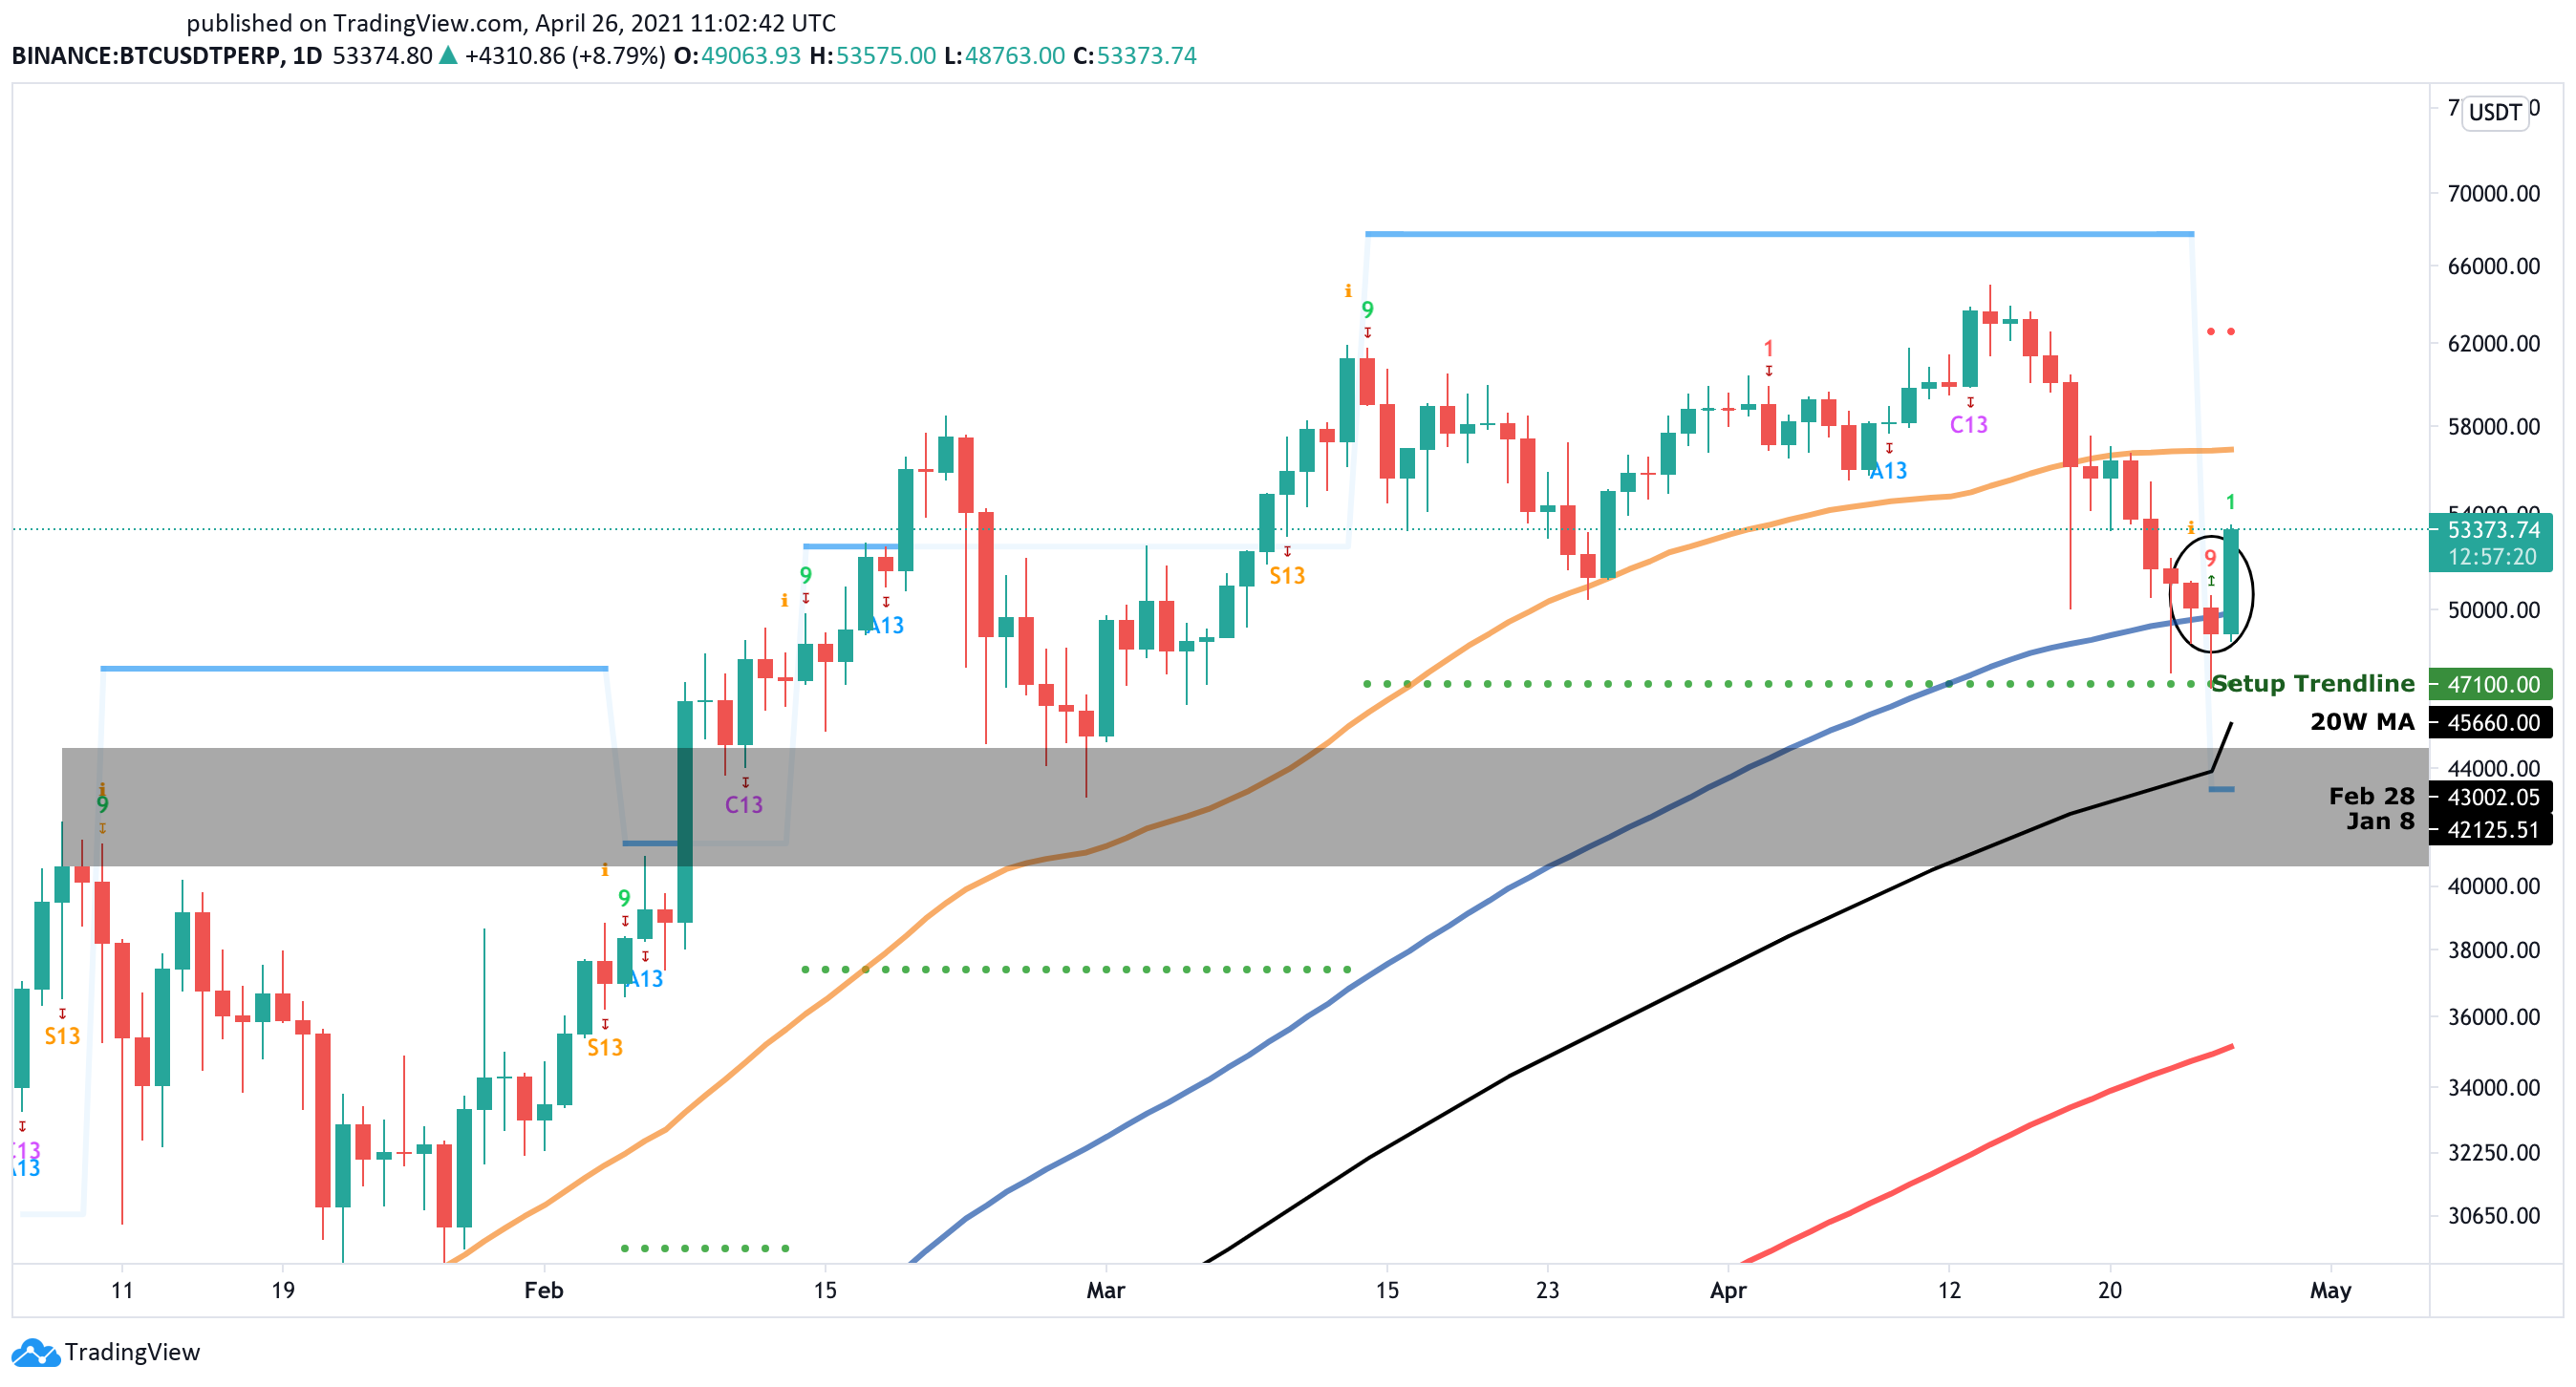
Failing to close above the 50-day moving average could lead to a retest of the $47,000 support.
It is worth noting that the area between $46,000 and $40,000 represents a significant demand barrier. This interest zone comprises the 20-week moving average at $45,660, Feb. 28’s low of $43,000, and Jan. 8’s high of $42,125.
Thus, further price depreciation may prove challenging.
Disclosure: At the time of writing, this author owned Bitcoin and Ethereum.