Bitcoin Cash Price Analysis BCH / USD: Looking For The Bottom
Support is holding, but for how long?

Share this article
- Bitcoin Cash is trading down around twenty percent from its weekly opening price
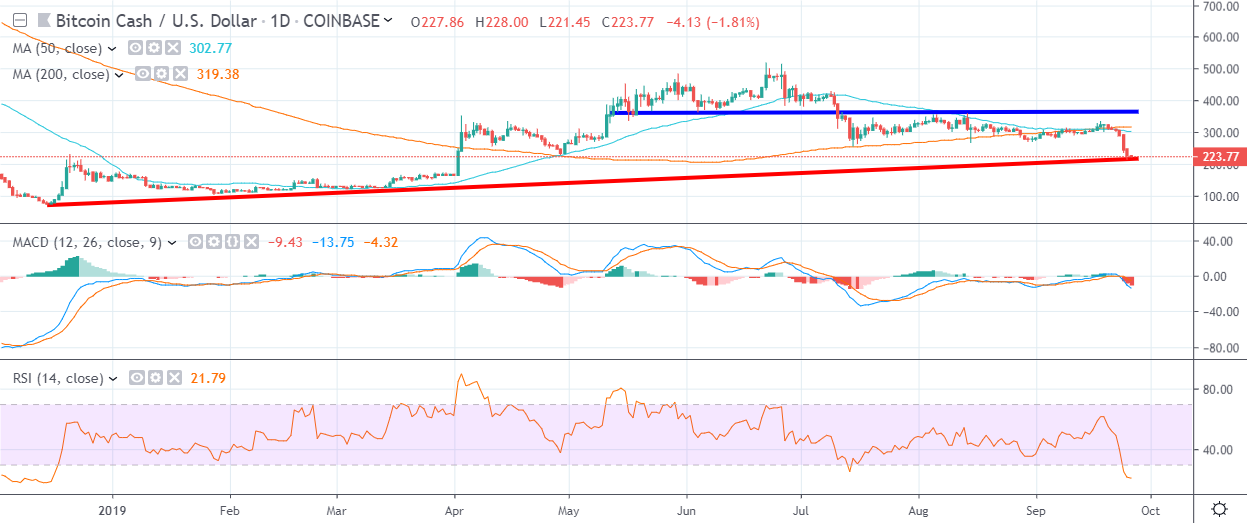
- The BCH / USD pair is testing a major long-term trendline on the daily time frame
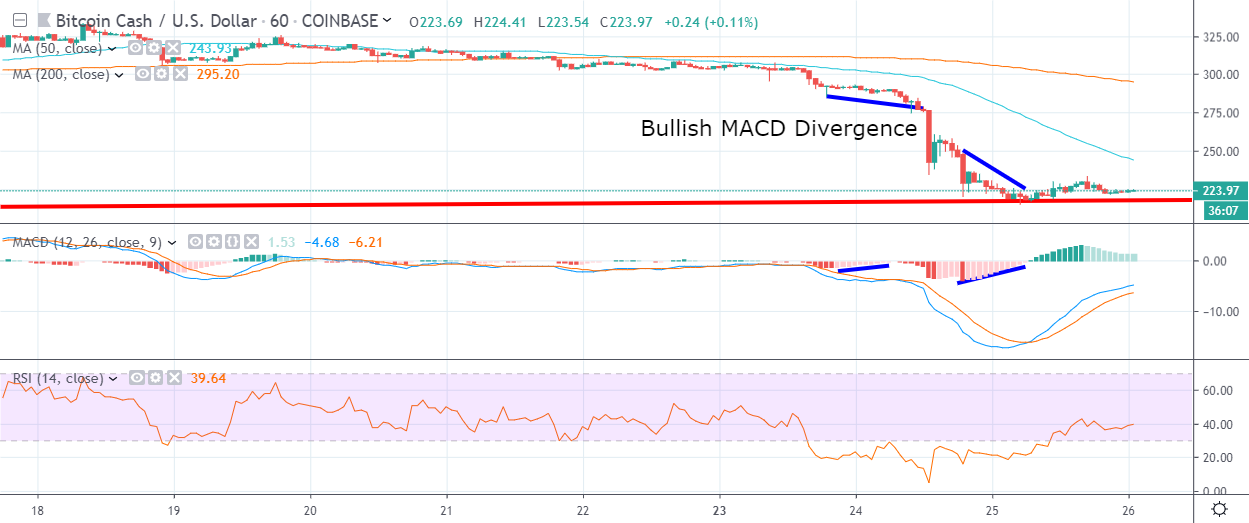
- The recent drop has created bullish MACD divergence extending towards the $290.00 level
Bitcoin Cash is consolidating around its current monthly trading low after the cryptocurrency suffered losses of around twenty percent, following the heavy early week decline in the cryptocurrency market.
The BCH / USD pair is now trading at its weakest level since April 2nd this year, with price probing a long-term trendline which could determine its fate going forward. Technical analysis suggests if price drops beneath the trendline, the cryptocurrency could tumble a further twenty percent.
The trendline in question has been in play since December 2018, with the BCH / USD pair remaining above the key trendline on the daily time frame ever since. Bitcoin Cash has seen a steady medium-term recovery while trading above the trendline, with the cryptocurrency peaking just above the $500.00 level this year.
The bearish breakout point is located around the $215.00 level and will be watched closely by traders over the coming sessions. A bounce from this key technical area will be encouraging for traders that are medium to long-term bullish towards Bitcoin Cash.
In the near-term, the recent decline in the BCH / USD pair has created significant amounts of bullish MACD price divergence on the one-hour time frame, which is a possible sign that a strong recovery in the cryptocurrency may be forthcoming.
The bullish MACD price divergence extends all-the-way towards the $290.00 level, which could be unwound if buyers can breakout above the most recent swing-high, around the $244.00 level.
Bullish MACD price divergence is also present from current levels to the $255.00 level. With the cryptocurrency market in full-on bear mode, a near-term recovery back towards the $255.00 level may be the more realistic scenario for the BCH / USD pair.
Sentiment
According to the latest sentiment data from TheTIE.io, the short-term sentiment towards Bitcoin Cash is bearish, at 36.00 %, while the overall long-term sentiment towards the cryptocurrency is bullish, at 61.00%.
Upside Potential
The one-hour time frame highlights the 50-period period moving average as the key upcoming resistance, around the $244.00 level. The next highest resistance level is $255.00.
The daily time frame highlights the $300.00 level as key, with bulls needing to mount a strong double-digit upside rally to reclaim the BCH / USD pair’s short-term bullish status.
Downside Potential
The downside is currently dominated by the previously mentioned long-term trendline, around the $215.00 level. Below this level the BCH / USD pair could quickly tumble towards the $200.00 level.
The daily time frame is currently showing that once below the $200.00 level, then the April 2nd trading low, around the $165.00 level, offers the strongest form of technical support.
Summary
Bitcoin Cash needs to stage a strong double-digit rally from current levels or it may suffer another round of heavy technical selling over the coming sessions.
The recently created bullish MACD price divergence suggests that the BCH / USD pair will eventually recover back towards the $290.00 resistance area.
Check out our coin guide for Bitcoin Cash.
Share this article
