
Bitcoin Cash Price Analysis BCH / USD: Clutching At Straws
BCH has found some support at its 200-day MA.
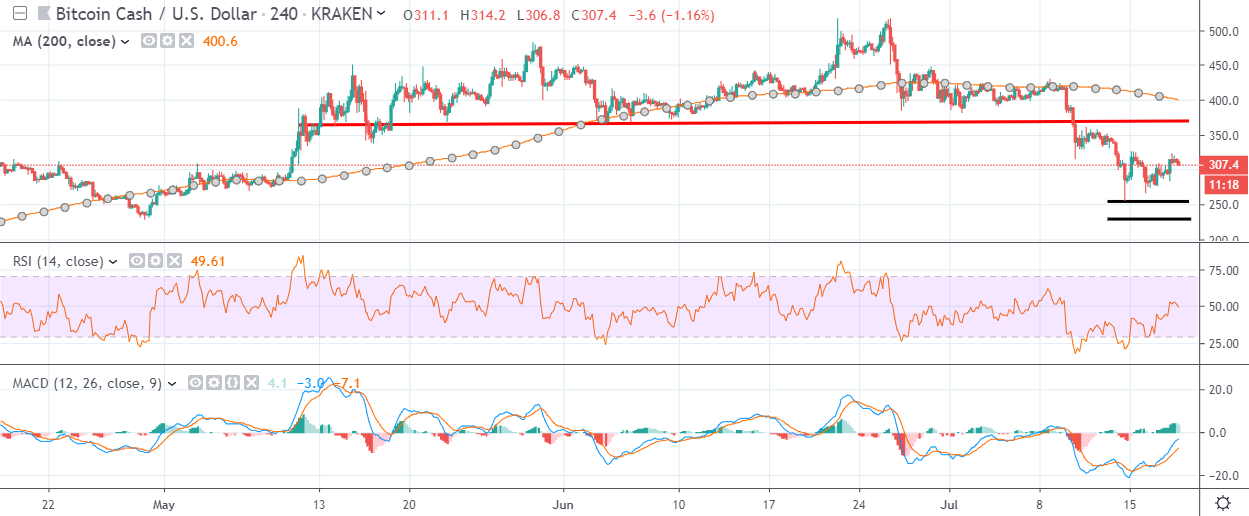
- Bitcoin Cash has a bearish short-term bias, with the BCH / USD pair still trading below its key 200-period moving average on the four-hour time frame
- The bearish head and shoulders pattern on the four-hour time frame has yet to reach its full downside projection
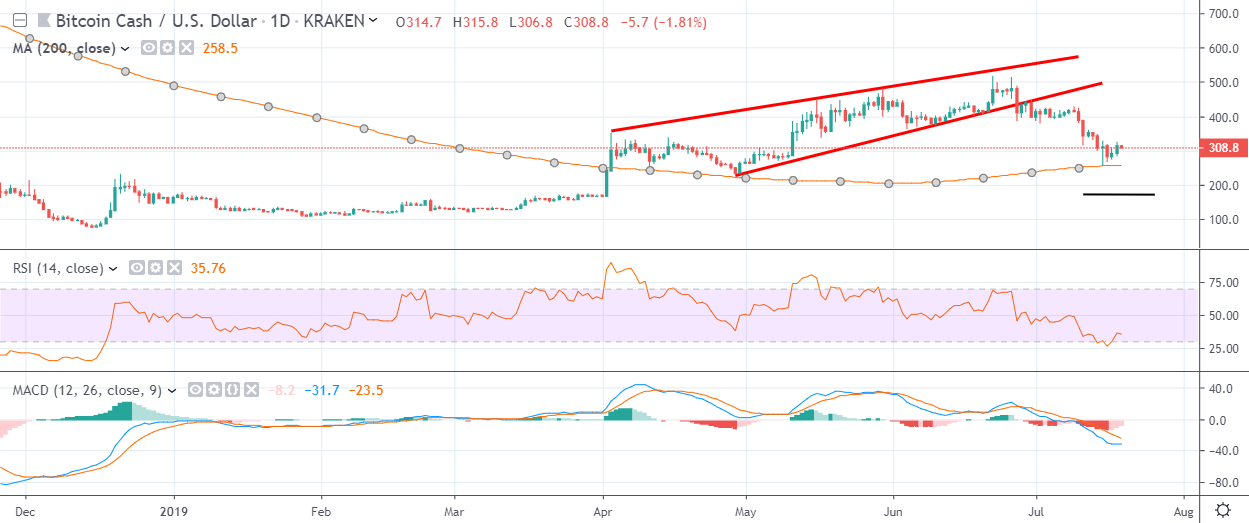
- The daily time frame shows that Bitcoin Cash has performed a bearish breakout from a rising wedge pattern
Bitcoin Cash / USD Short-term price analysis
Bitcoin Cash has a bearish short-term trading bias, with the BCH / USD pair trading below its 200-period moving average on the four-hour time frame.
The four-hour time frame shows that a bearish head and shoulders pattern has been triggered, with the move lower so far extending towards the $250.00 level.
Major short-term technical resistance for the BCH / USD pair is now located at the $330.00 and $370.00 levels.
Technical indicators on the four-hour time frame have turned bullish, following a much-needed correction from oversold conditions.
Pattern Watch
Traders should note that the bearish head and shoulders pattern on the four-hour time frame has yet to reach its full downside projection.
Relative Strength Index
The RSI indicator on the four-hour time has turned bullish and is now starting to generate a buy signal.
MACD Indicator
The MACD indicator on the four-hour time frame has turned bullish, with the MACD signal line and histogram now issuing buy signals.
Bitcoin Cash / USD Medium-term price analysis
Bitcoin Cash has a bullish medium-term trading outlook, with the BCH / USD pair still holding above its key 200-day moving average.
The daily time frame is showing that the BCH / USD pair has fallen sharply lower, following a strong bearish breakout from a rising wedge pattern.
Critical support on the daily time frame is located at the $255.00 and $170.00 level.
Technical indicators on the daily time frame are still bearish and continue to generate sell signal.
Pattern Watch
Traders should note that a bearish breakout below the BCH / USD pair’s 200-day moving average may provoke heavy selling below the $200.00 level.
Relative Strength Index
The RSI indicator on the daily time frame is technically bearish, although it is attempting to correct from oversold conditions.
MACD Indicator
The MACD indicator on the daily time frame remains bearish and shows scope for further downside.
Conclusion
Bitcoin Cash has found solid technical support from its 200-day moving average, with this key technical metric now likely to define the BCH / USD pair’s next strong directional bias.
A degree of caution is also advised to BCH / USD bulls, as the bearish patterns across both time horizons have yet to reach their overall downside targets.
Check out our coin guide for Bitcoin Cash.