Bitcoin Cash Price Analysis BCH / USD: Stuck In Traffic
BCH is bouncing up and down in a narrow band.

Share this article
- Bitcoin Cash has a bearish short-term bias, with the BCH / USD pair still trading below its key 200-period moving average on the four-hour time frame
- A bearish head and shoulders pattern has now formed on the four-hour time frame
- The daily time frame highlights that Bitcoin Cash is trapped within a rising price channel
Bitcoin / USD Short-term price analysis
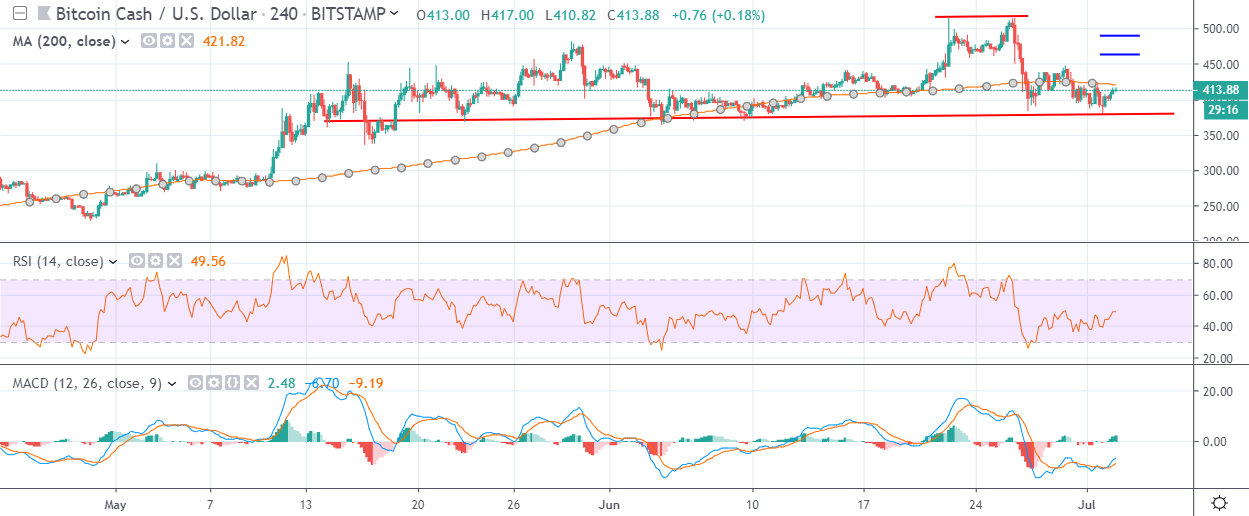
Bitcoin Cash has a bearish short-term trading bias, with the BCH / USD pair trading below its 200-period moving average on the four-hour time frame.
The four-hour time frame shows that a bearish head and shoulders pattern has been formed after a strong technical rejection from the $500.00 resistance level.
Major short-term resistance for the BCH / USD pair is now located at the $450.00 and $480.00 levels.
Technical indicators on the four-hour time frame are attempting to turn bullish, following the recent correction lower.
Pattern Watch
Traders should note that the bearish head and shoulders pattern on the four-hour time frame has a downside projection of over $150.00.
Relative Strength Index
The RSI indicator on the four-hour time is neutral and has yet to generate a confirmed bullish signal.
MACD Indicator
The MACD indicator on the four-hour time frame is starting to turn bullish, with the MACD signal line and histogram issuing a buy signal.
Bitcoin Cash / USD Medium-term price analysis
Bitcoin Cash has a bullish medium-term trading outlook, with the BCH / USD pair still trading above its key 200-day moving average.
The daily time frame is showing that the BCH / USD pair is still trapped within a large rising price channel, following numerous false breakouts above it.
Technical indicators on the daily time frame are bearish and continue to generate a sell signal.

Pattern Watch
Traders should note that multiple failed attempts around trendline resistance may provoke a move back towards the bottom of the price channel.
Relative Strength Index
The RSI indicator on the daily time frame is bearish and continues to generate a sell signal.
MACD Indicator
The MACD indicator on the daily time frame is bearish, with both the MACD signal line and histogram issuing sell signals.
Conclusion
Bitcoin Cash has staged a strong reversal from the $500.00 level, with the move lower helping to form a bearish head and shoulders pattern on the four-hour time frame.
If bulls fail to rally the BCH / USD pair back above the $500.00 level medium-term sellers may force the cryptocurrency back towards channel support.
Check out our coin guide for Bitcoin Cash.
Share this article
