Bitcoin Cash Price Analysis BCH / USD: Target Acquired
Technicals show that BCH has the $390 level as price target.

Share this article
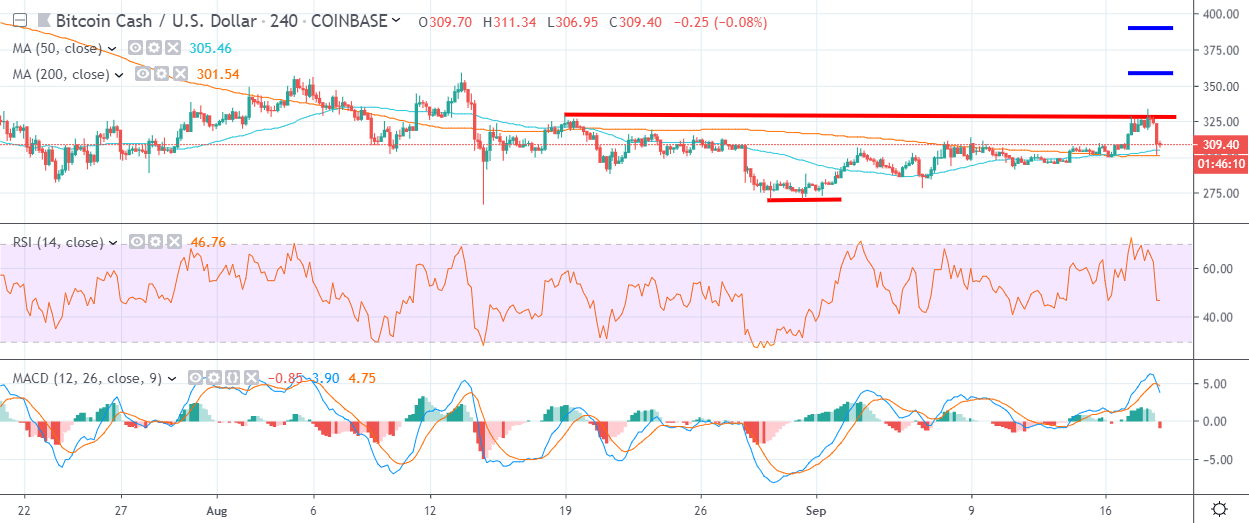
- Bitcoin Cash has reversed course after finding strong resistance from the $335.00 level
- The BCH / USD pair has a bullish short-term bias while trading above the $300.00 level
- Technical analysis highlights the $360.00 and $390.00 levels as potential bullish targets
Bitcoin Cash is reversing course on Thursday after launching an explosive bullish rally towards the $335.00 resistance level earlier this week. An unexpected move lower in the broader cryptocurrency market has seen the BCH / USD pair pushed back towards the $300.00 level.
Despite the pullback, the cryptocurrency is still showing signs that the recent recovery may be more than just a technical correction. A large bullish pattern has formed on the four-hour time frame, which suggests that the cryptocurrency could eventually advance towards the $390.00 technical region.
Short-term technical analysis highlights that bulls will remain in control of the cryptocurrency while price trades above the 200-period moving average on the four-hour time frame, around the $300.00 level. Interestingly, the BCH / USD pair has also turned technically bullish over the medium-term for the first-time this month.
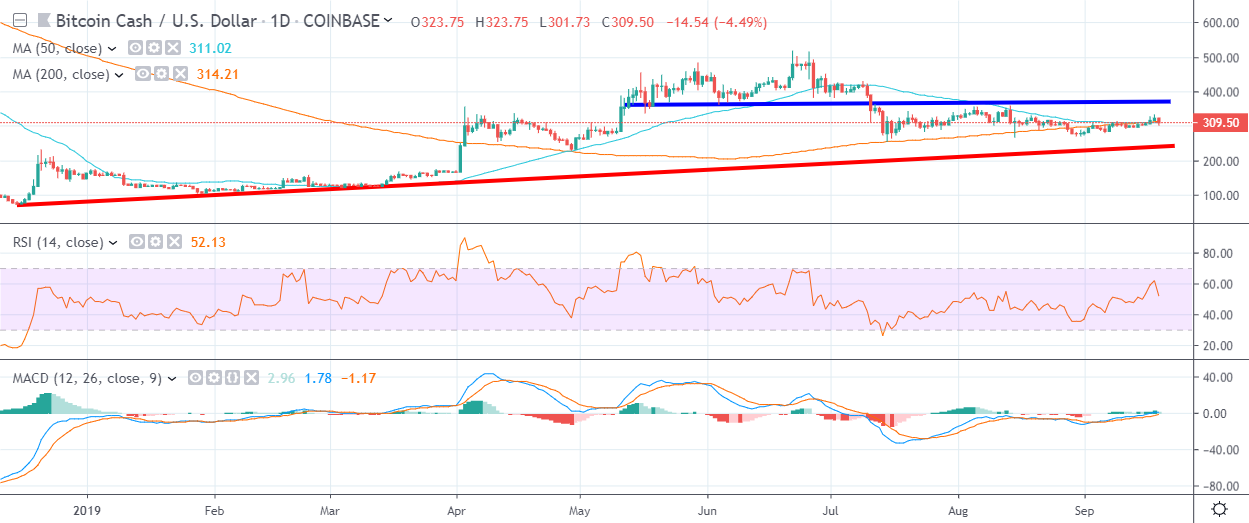
The cryptocurrency has spent two-days above its key 200-day moving average, with this key technical metric currently located around the $312.00 level. Furthermore, the cryptocurrency is also holding firm above its 50-day moving average, which is certainly a bullish development.
Should we continue to see the BCH / USD pair holding above its 200-day moving average, we should expect further gains towards at least the $360.00 level, which represents the most significant recent swing-high, from August 13th this year.
Medium-term analysis highlights that $385.00 to $395.00 area as likely medium-term bullish target if the upside move continues. The projected move towards the $395.00 level from current trading levels would mark a twenty-seven percent increase in value for the BCH / USD pair and a fifty-four percent increase from the summer trading low.
According to the latest sentiment data from TheTIE.io, the short-term sentiment towards Bitcoin Cash has taken a hit, to 46.00 %, while the overall long-term sentiment towards the cryptocurrency is fairly bullish, at 61.00%.
Upside Potential
The four-hour time frame is showing that the BCH / USD pair has created a bullish inverted head and shoulders pattern, with an upside projection of around $60.00. The bullish breakout area is now located around the $235.00 level.
The daily time frame highlights that bulls are in charge while price trades above the $312.00 level. Bullish medium-term targets are found between the $385.00 to $395.00 resistance areas.
Downside Potential
The four-hour time frame is showing that major short-term technical support is located around the $300.00 level. Key support under the $300.00 level is found at the $290.00 and $285.00 levels.
The daily time frame is currently showing that major long-term trendline support around the $235.00 level will come into focus if the summer low, around the $265.00 level, is broken.
Summary
Bitcoin Cash could easily add to its recent gains if buyers can continue to hold price above the cryptocurrencies 200-day moving average, around the $312.00 level.
Any sustained moves above the $335.00 level should trigger short and medium-term BCH / USD buyers to push price towards at least the $360.00 area.
Check out our coin guide for Bitcoin Cash.
Share this article
