 Earn with Nexo

Bitcoin Cash / USD Technical Analysis: Rogue Wave
BCH / USD Technical Analysis - The pair has seen immense gains in the past week, but a strong correction is overdue
[vc_row][vc_column][vc_column_text]
- Bitcoin Cash has a bullish short-term bias, with the BCH / USD pair touching levels not seen since November 2018
- Bullish MACD price divergence on the daily time frame has now been reversed
- Bitcoin Cash has a bullish outlook over the medium-term horizon
Bitcoin Cash / USD Short-term price analysis
Bitcoin Cash has a bullish short-term trading bias, with the BCH / USD pair advancing towards levels not seen since November 2018.
The four-hour time frame highlights the strong technical breakout that occurred once the BCH / USD pair broke from its two-week trading range.
If any downward technical corrections occur, the BCH / USD pair’s 200-period moving average on the four-hour time frame is currently the strongest form of near-term support.
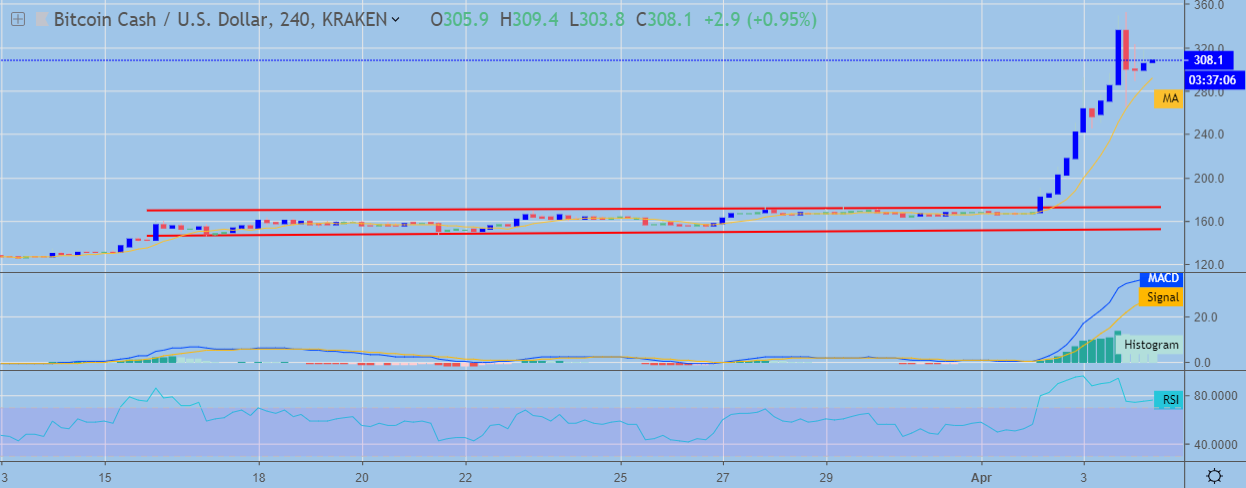 BCH / USD H4 Chart (Source: TradingView)
Pattern Watch
Traders should note that the four-hour time frame is showing a bearish reversal candle.
Relative Strength Index
The RSI indicator on the four-hour time is correcting lower after moving into extreme overbought territory.
MACD Indicator
The MACD indicator on the four-hour time frame is starting to appear overstretched.
Bitcoin Cash / USD Medium-term price analysis
Bitcoin Cash has a bullish medium-term outlook, with the BCH / USD pair now trading above its trend defining 200-day moving average.
The BCH / USD pair has now reversed any bullish divergence on the daily time frame, while the inverted head and shoulders pattern on the mentioned time frame has reached its overall upside objective.
Key technical support over the medium-term is now found at the neckline of the inverted head and shoulders pattern and the BCH / USD pair’s 200-day moving average.
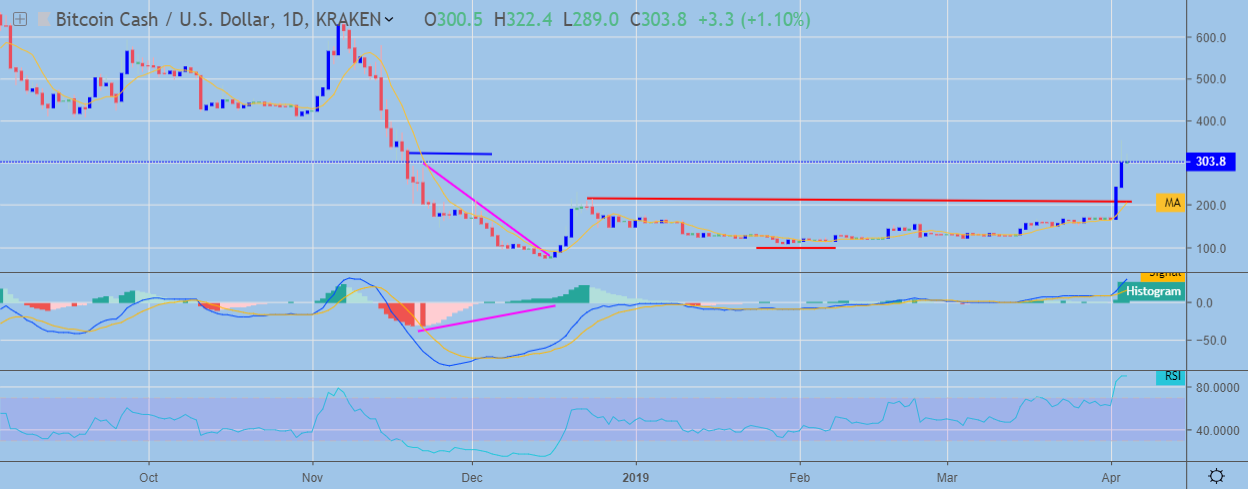 BCH / USD Daily Chart (Source: TradingView)
Pattern Watch
Traders should note that the chance of a strong technical reversal has increased, now that the bullish pattern on the daily time frame has reached its overall upside target.
Relative Strength Index
The RSI indicator on the daily time frame is now extremely overbought.
MACD Indicator
The MACD indicator on the daily time frame is bullish and continues to generate a bullish trading signal.
Conclusion
Bitcoin Cash has gained close to one-hundred percent in value so far this week, with the BCH / USD pair staging its strongest weekly advance since April 2018.
With the bullish MACD price divergence now reversed and the inverted head and shoulders pattern on the daily time frame reaching its overall upside objective, the risks of a strong technical correction lower in the BCH / USD pair have increased.
We wrote a brief coin guide to the Bitcoin fork which you can check out here.
Decentral Media, Inc., the publisher of Crypto Briefing, is not an investment advisor and does not offer or provide investment advice or other financial advice. Nothing on this website constitutes, or should be relied on as, investment advice or financial advice of any kind. Specifically, none of the information on this website constitutes, or should be relied on as, a suggestion, offer, or other solicitation to engage in, or refrain from engaging in, any purchase, sale, or any other any investment-related activity with respect to any transaction. You should never make an investment decision on an investment based solely on the information on our website, and you should never interpret or otherwise rely on any of the information on this website as investment advice. We strongly recommend that you consult a licensed investment advisor or other qualified financial professional if you are seeking investment advice on an investment.
[/vc_column_text][/vc_column][/vc_row]