
Bitcoin Crosses Pivotal Moving Average, Indicates Impending Bull Market
The power of Bitcoin's 200-day moving average.
Bitcoin crossed a pivotal moving average signaling an impending bull market, according to one prominent analyst.
Bull Market on BTC’s Horizon?
Thomas Lee, Managing Partner and Head of Research at Fundstrat Global Advisors, recently pointed out that Bitcoin has reached a “positive milestone” that could shape up the rest of the year.
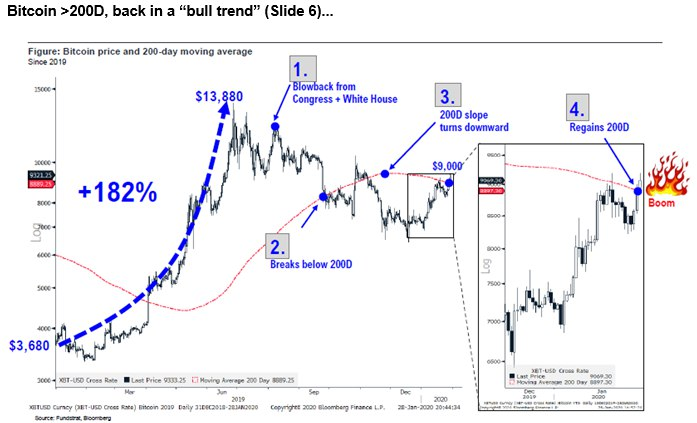
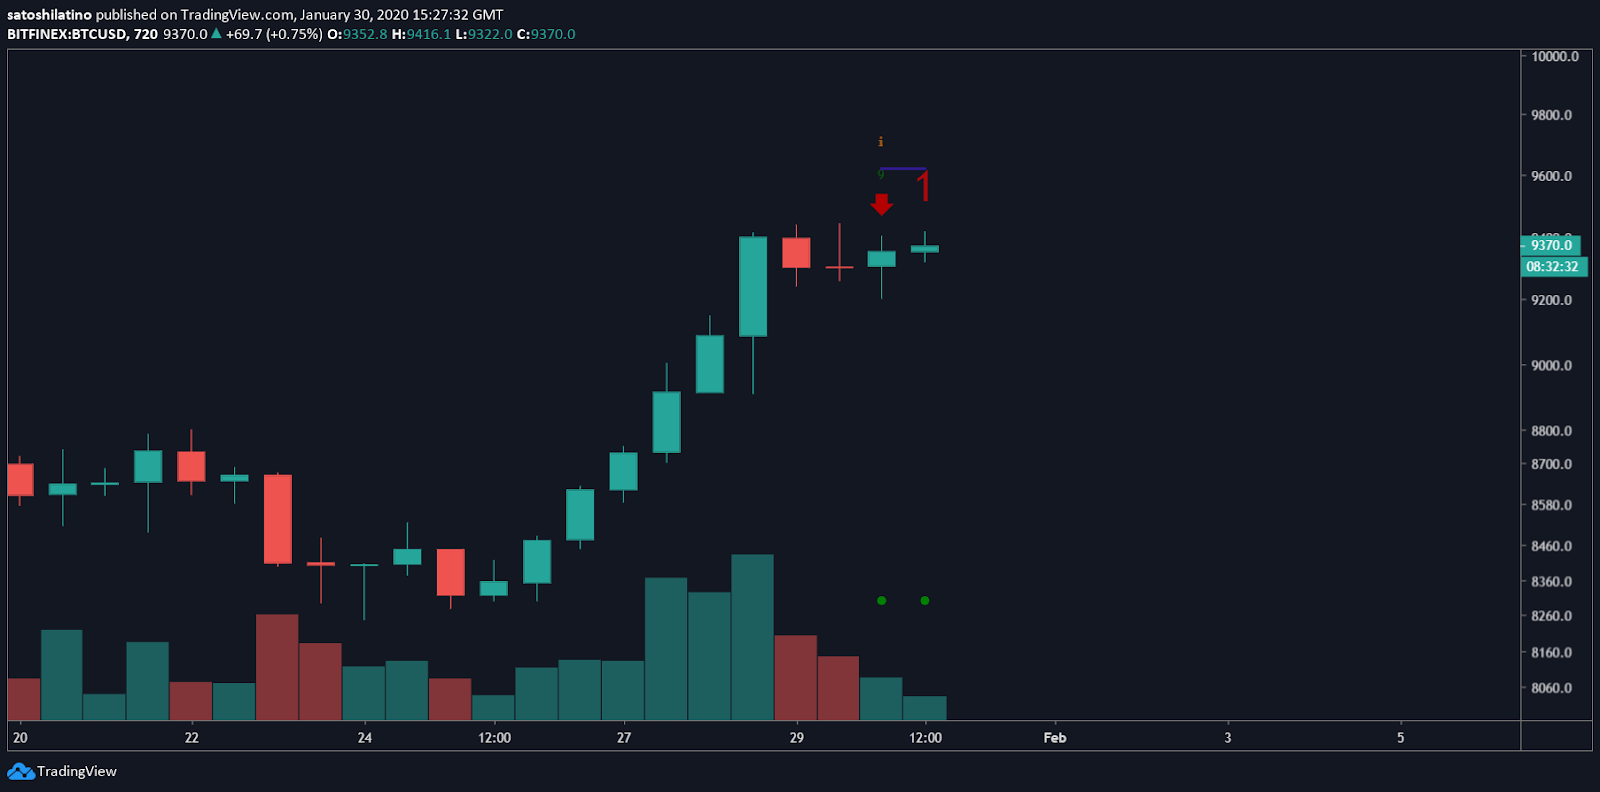
Since Jan. 3, the flagship cryptocurrency entered an uptrend that saw its price rise 37%. BTC went from trading at a low of $6,900 to a high of $9,440 on Jan. 29. However, it was on Jan. 27 when the bullish impulse allowed Bitcoin to move back above its 200-day moving average (MA).
Closing above this significant resistance level reinforces that 2020 will be a great year for the pioneer cryptocurrency, according to Lee. The analyst maintains that whenever Bitcoin moves above the 200-day MA, it usually skyrockets over 80% “essentially re-entering [a] bull market.”
Based on the coin’s price history, it appears that breaking above the 200-day MA serves as a catalyst for a new uptrend, but this phenomenon has only taken place three times since Bitcoin’s inception.
The Power of Bitcoin’s 200-day MA
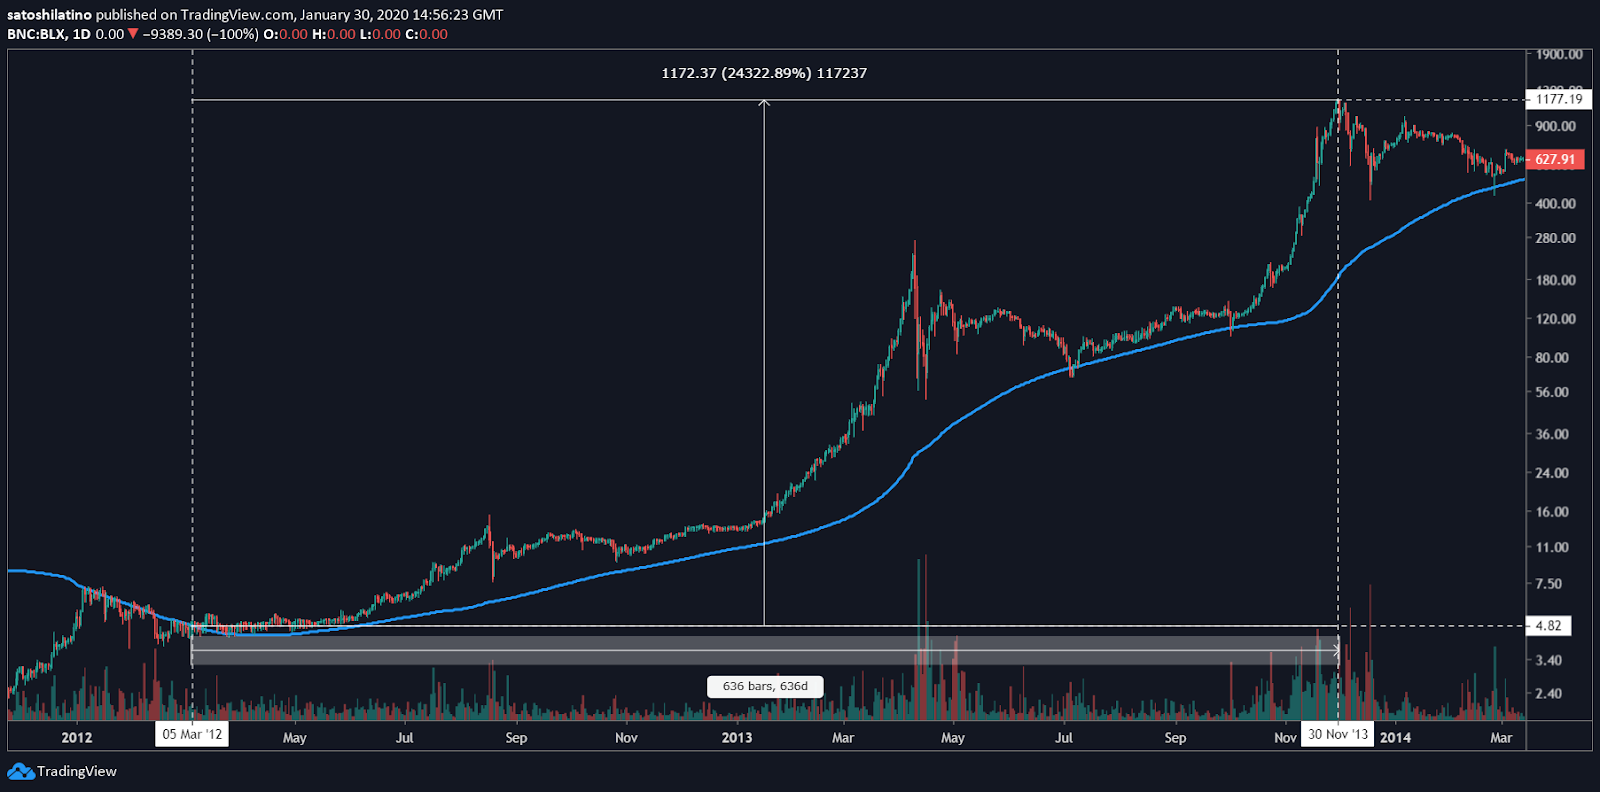
The first time Bitcoin turned the 200-day MA into support was in March 2012. Moving above this barrier was the factor that led to a whopping 243x bull market. The pioneer cryptocurrency went from trading around $4.82 to an eye-popping high of $1,177.
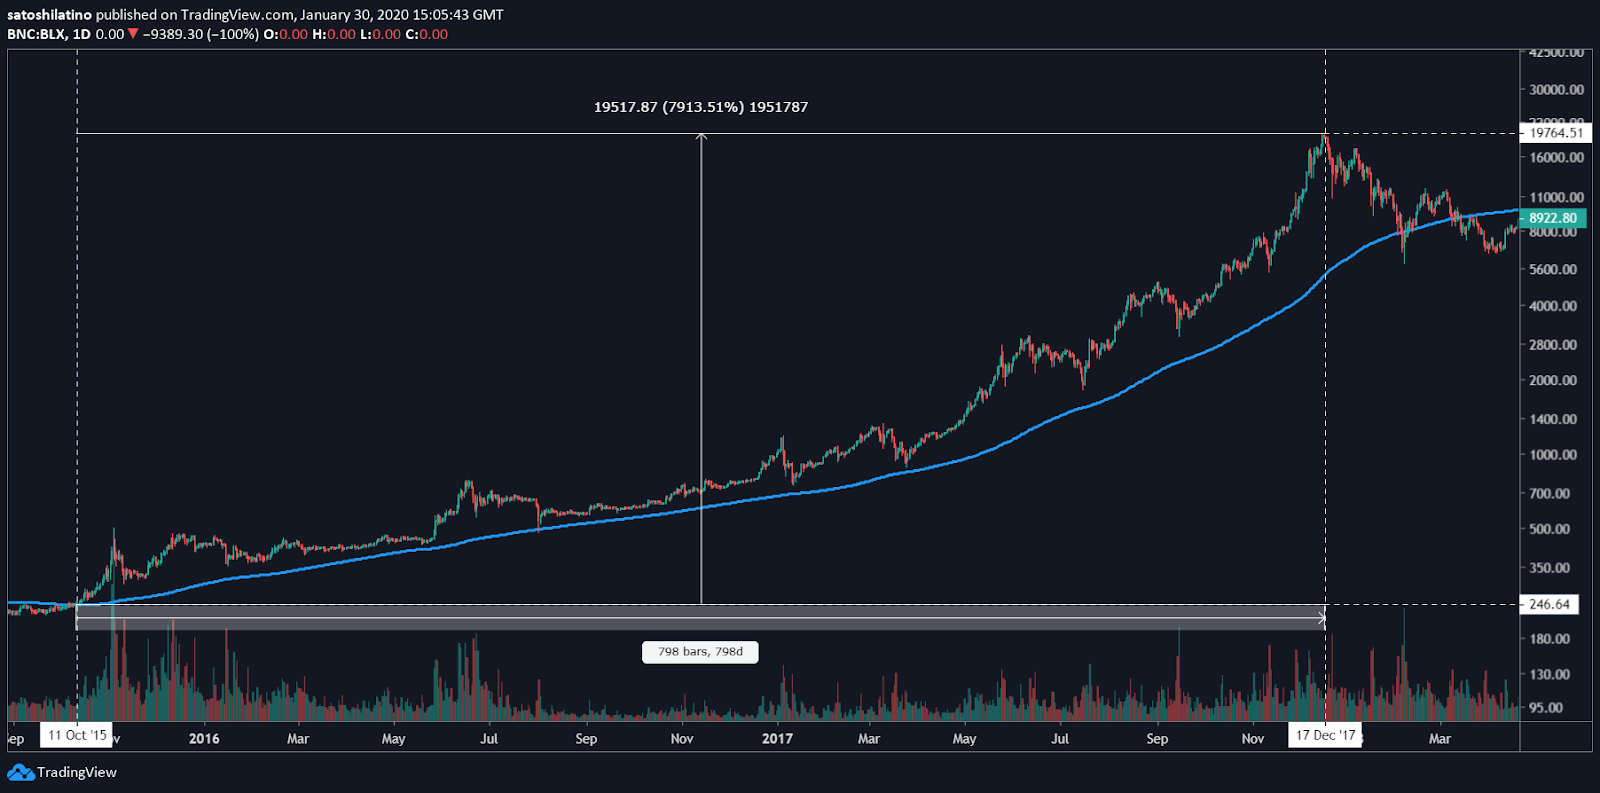
The second 200-day MA crossover took place in October 2015. Breaking this price hurdle signaled the beginning of a new bull market at the time. Bitcoin indeed entered a parabolic move that saw its price surge by 79x. The flagship cryptocurrency went from hovering at a low of $247 to an all-time high of $19,765 in December 2017.
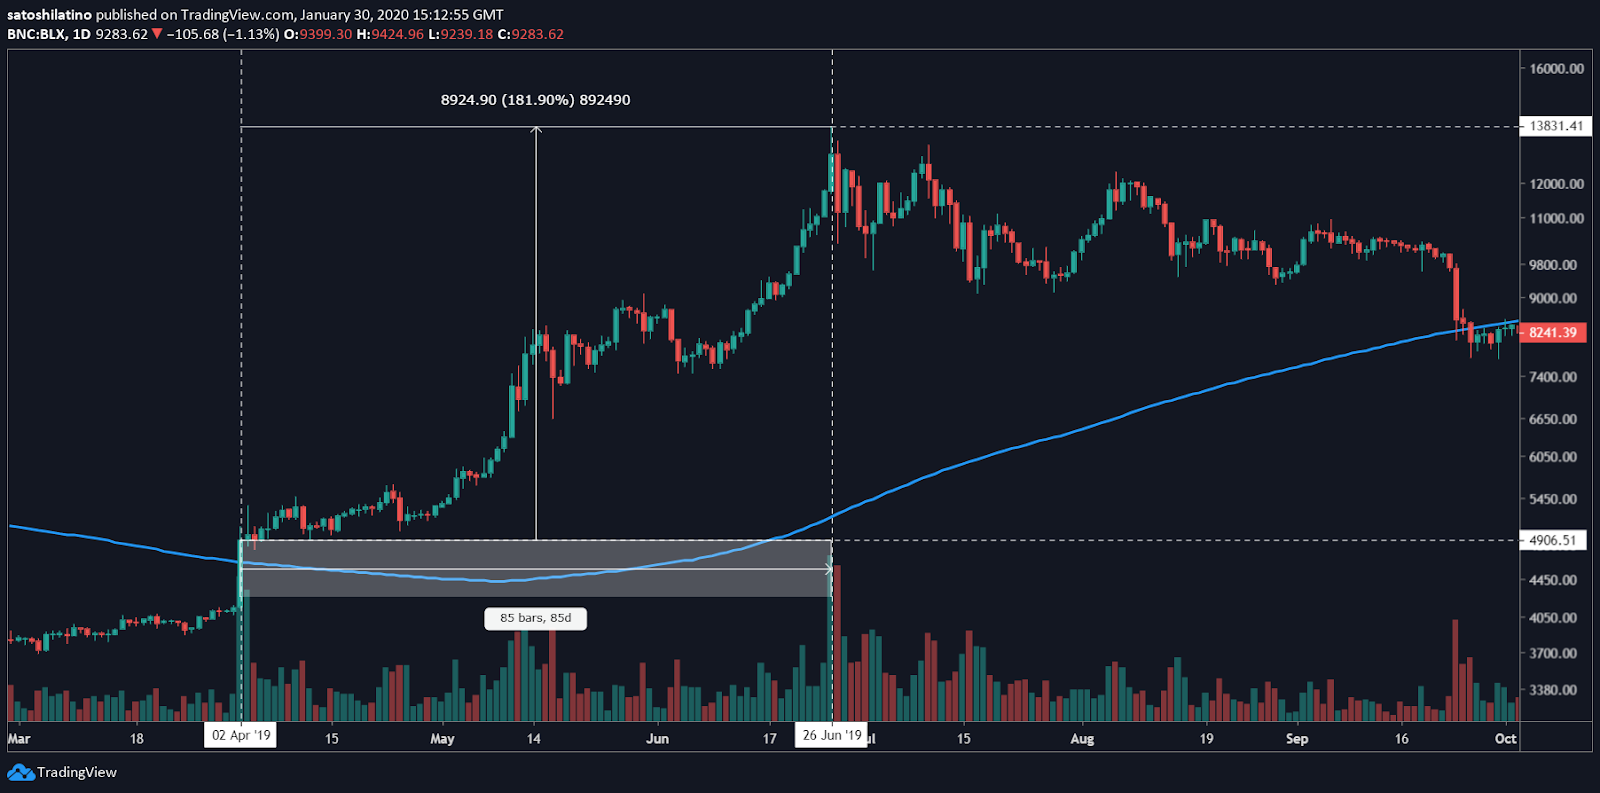
Finally, Bitcoin was able to move above the 200-day MA for a third time on Apr. 2, 2019. This time around, however, turning this price level into support did not push the price of BTC up exponentially. Although, the flagship cryptocurrency still surged 182% to peak at nearly $14,000 on June 26, 2019.
Factors to Consider
Although closing above the 200-day MA has certainly set the stage for a full blown bullish trend, there are other factors to consider before placing a buy.
First, Bitcoin can move back below this moving average at any time given an increased volume of sell orders. Such a pullback has occurred many times before and usually leads to new swing lows.
Second, the TD sequential indicator is currently presenting a sell signal in the form of a green nine candlestick on BTC’s 12-hour chart. This technical index estimates a one to four candlestick correction or the beginning of a downward countdown. An increase in the selling pressure behind Bitcoin could push it below the 200-day MA, triggering a more serious retracement.
Based on these factors, investors must understand that a close above the 200-day moving average is not definite proof of the beginning of a new bull rally. It just serves as an indicator that a parabolic move could be underway. But history could once again repeat itself, rewarding risk takers.