
Shutterstock cover by Lukasz Stefanski
Bitcoin, Ethereum Suffer Crash But Support Holds
Bitcoin and Ethereum have managed to bounce back above support after incurring significant losses in Tuesday's crash.
Bitcoin and Ethereum, alongside most altcoins in the market, have incurred significant losses over the past 24 hours. However, both assets are holding above a crucial support barrier that may prevent them from a steeper decline.
The Crypto Markets Bleed
The two leading cryptocurrencies are sitting on support despite the recent dip.
More than $300 billion has been wiped out of the entire cryptocurrency market capitalization in the last 24 hours. The sudden crash generated nearly $3.5 billion in liquidations worth of long and short positions across the board.
Almost every digital asset in the blockchain space has suffered from the sell-off. Even the stablecoins USDT and USDC briefly dropped by approximately 0.54%, sending investors into fear.
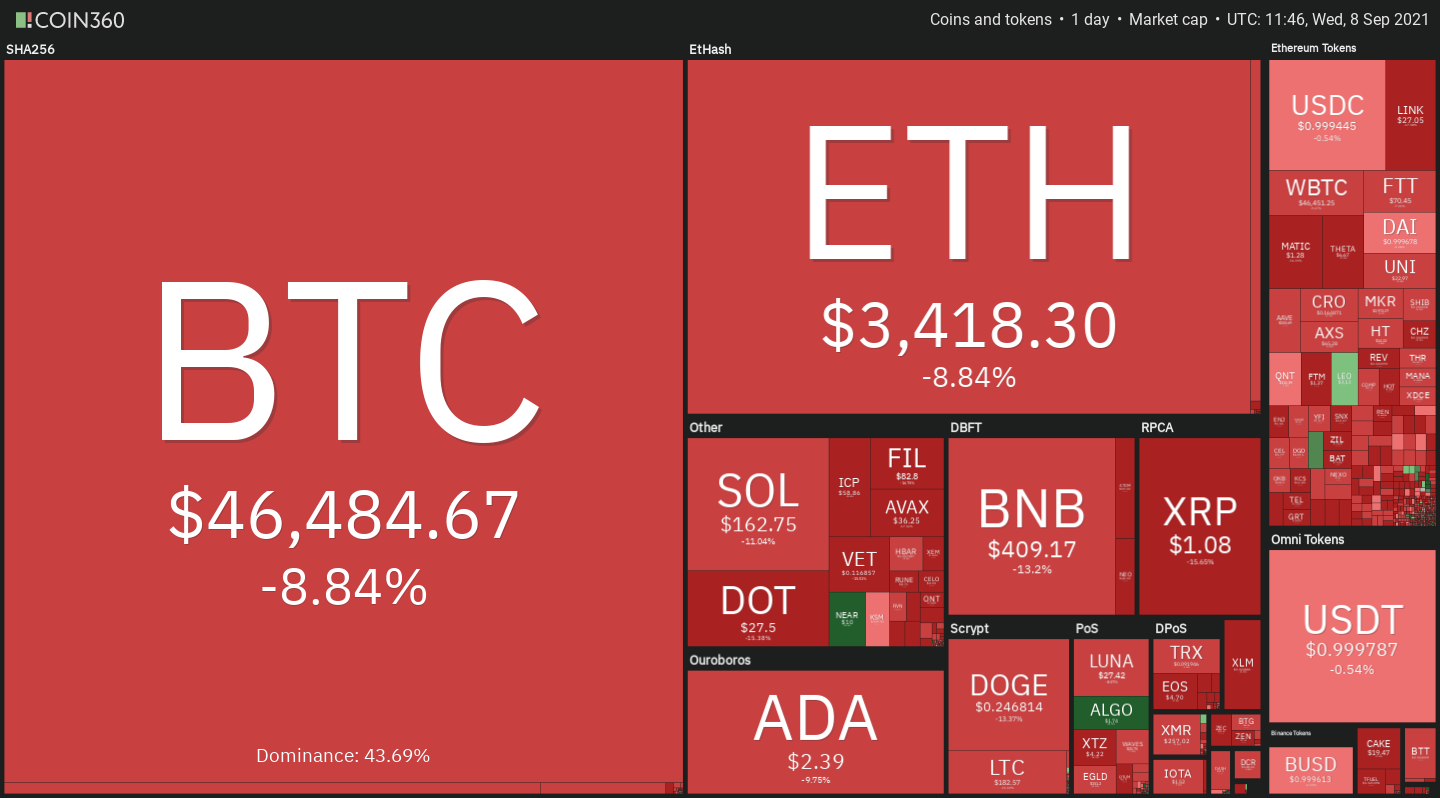
Only a few altcoins were trading in the green today, including Algorand, Near Protocol, and IOST.
Bitcoin Shakes Out Weak Hands
The leading cryptocurrency was one of the many digital assets that could not hold on to support. Bitcoin shed over 10,000 points within a few hours, going from a high of $52,900 to a low of $42,600.
Although prices have managed to bounce back above $46,000, the outlook remains uncertain.
Bitcoin’s daily chart shows that it sits on top of a support cluster that extends from $45,800 to $42,500. The 200 and 50-day moving averages and the 50% and 61.8% Fibonacci retracement levels lie within this price range. This significant support barrier could have the ability to prevent prices from dropping further due to the magnitude of the recent downswing.
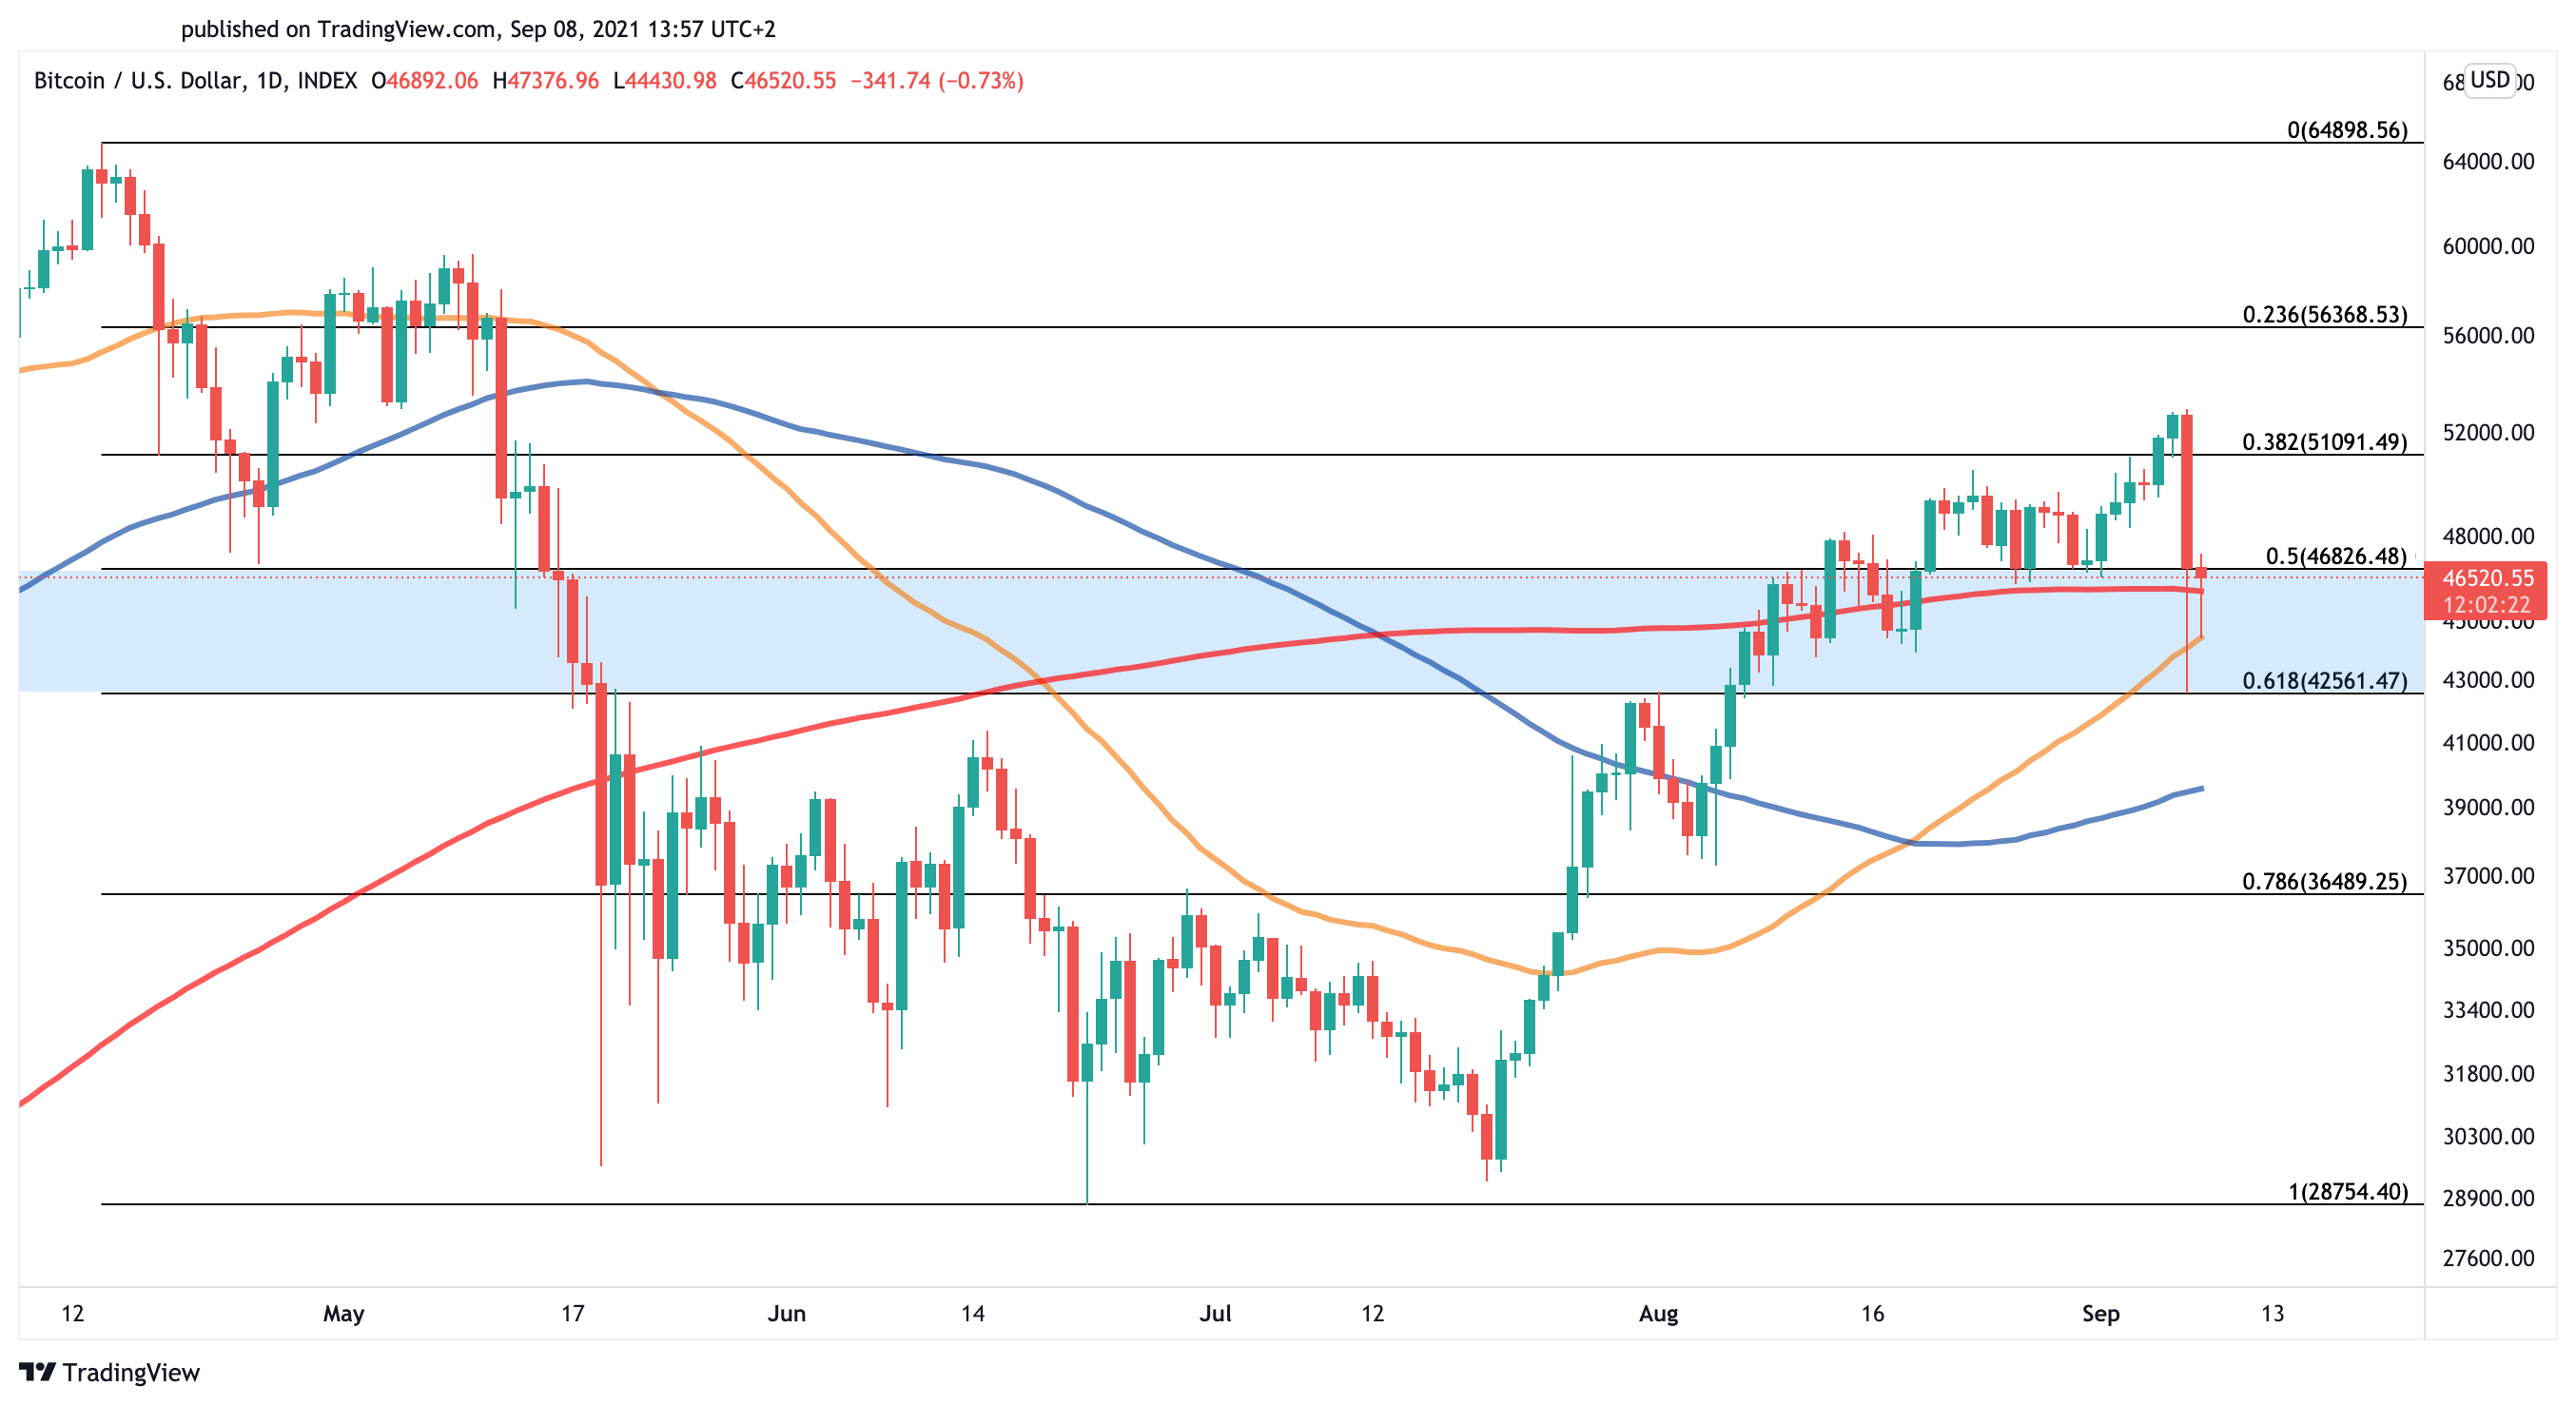
As long as the $45,800 to $42,500 demand wall holds, Bitcoin may trade sideways until its next major price movement. A candlestick close above the $51,000 resistance level could signal the resumption of the uptrend, while a sustained drop below $42,500 may result in a correction towards $36,500.
Ethereum Held by Key Support
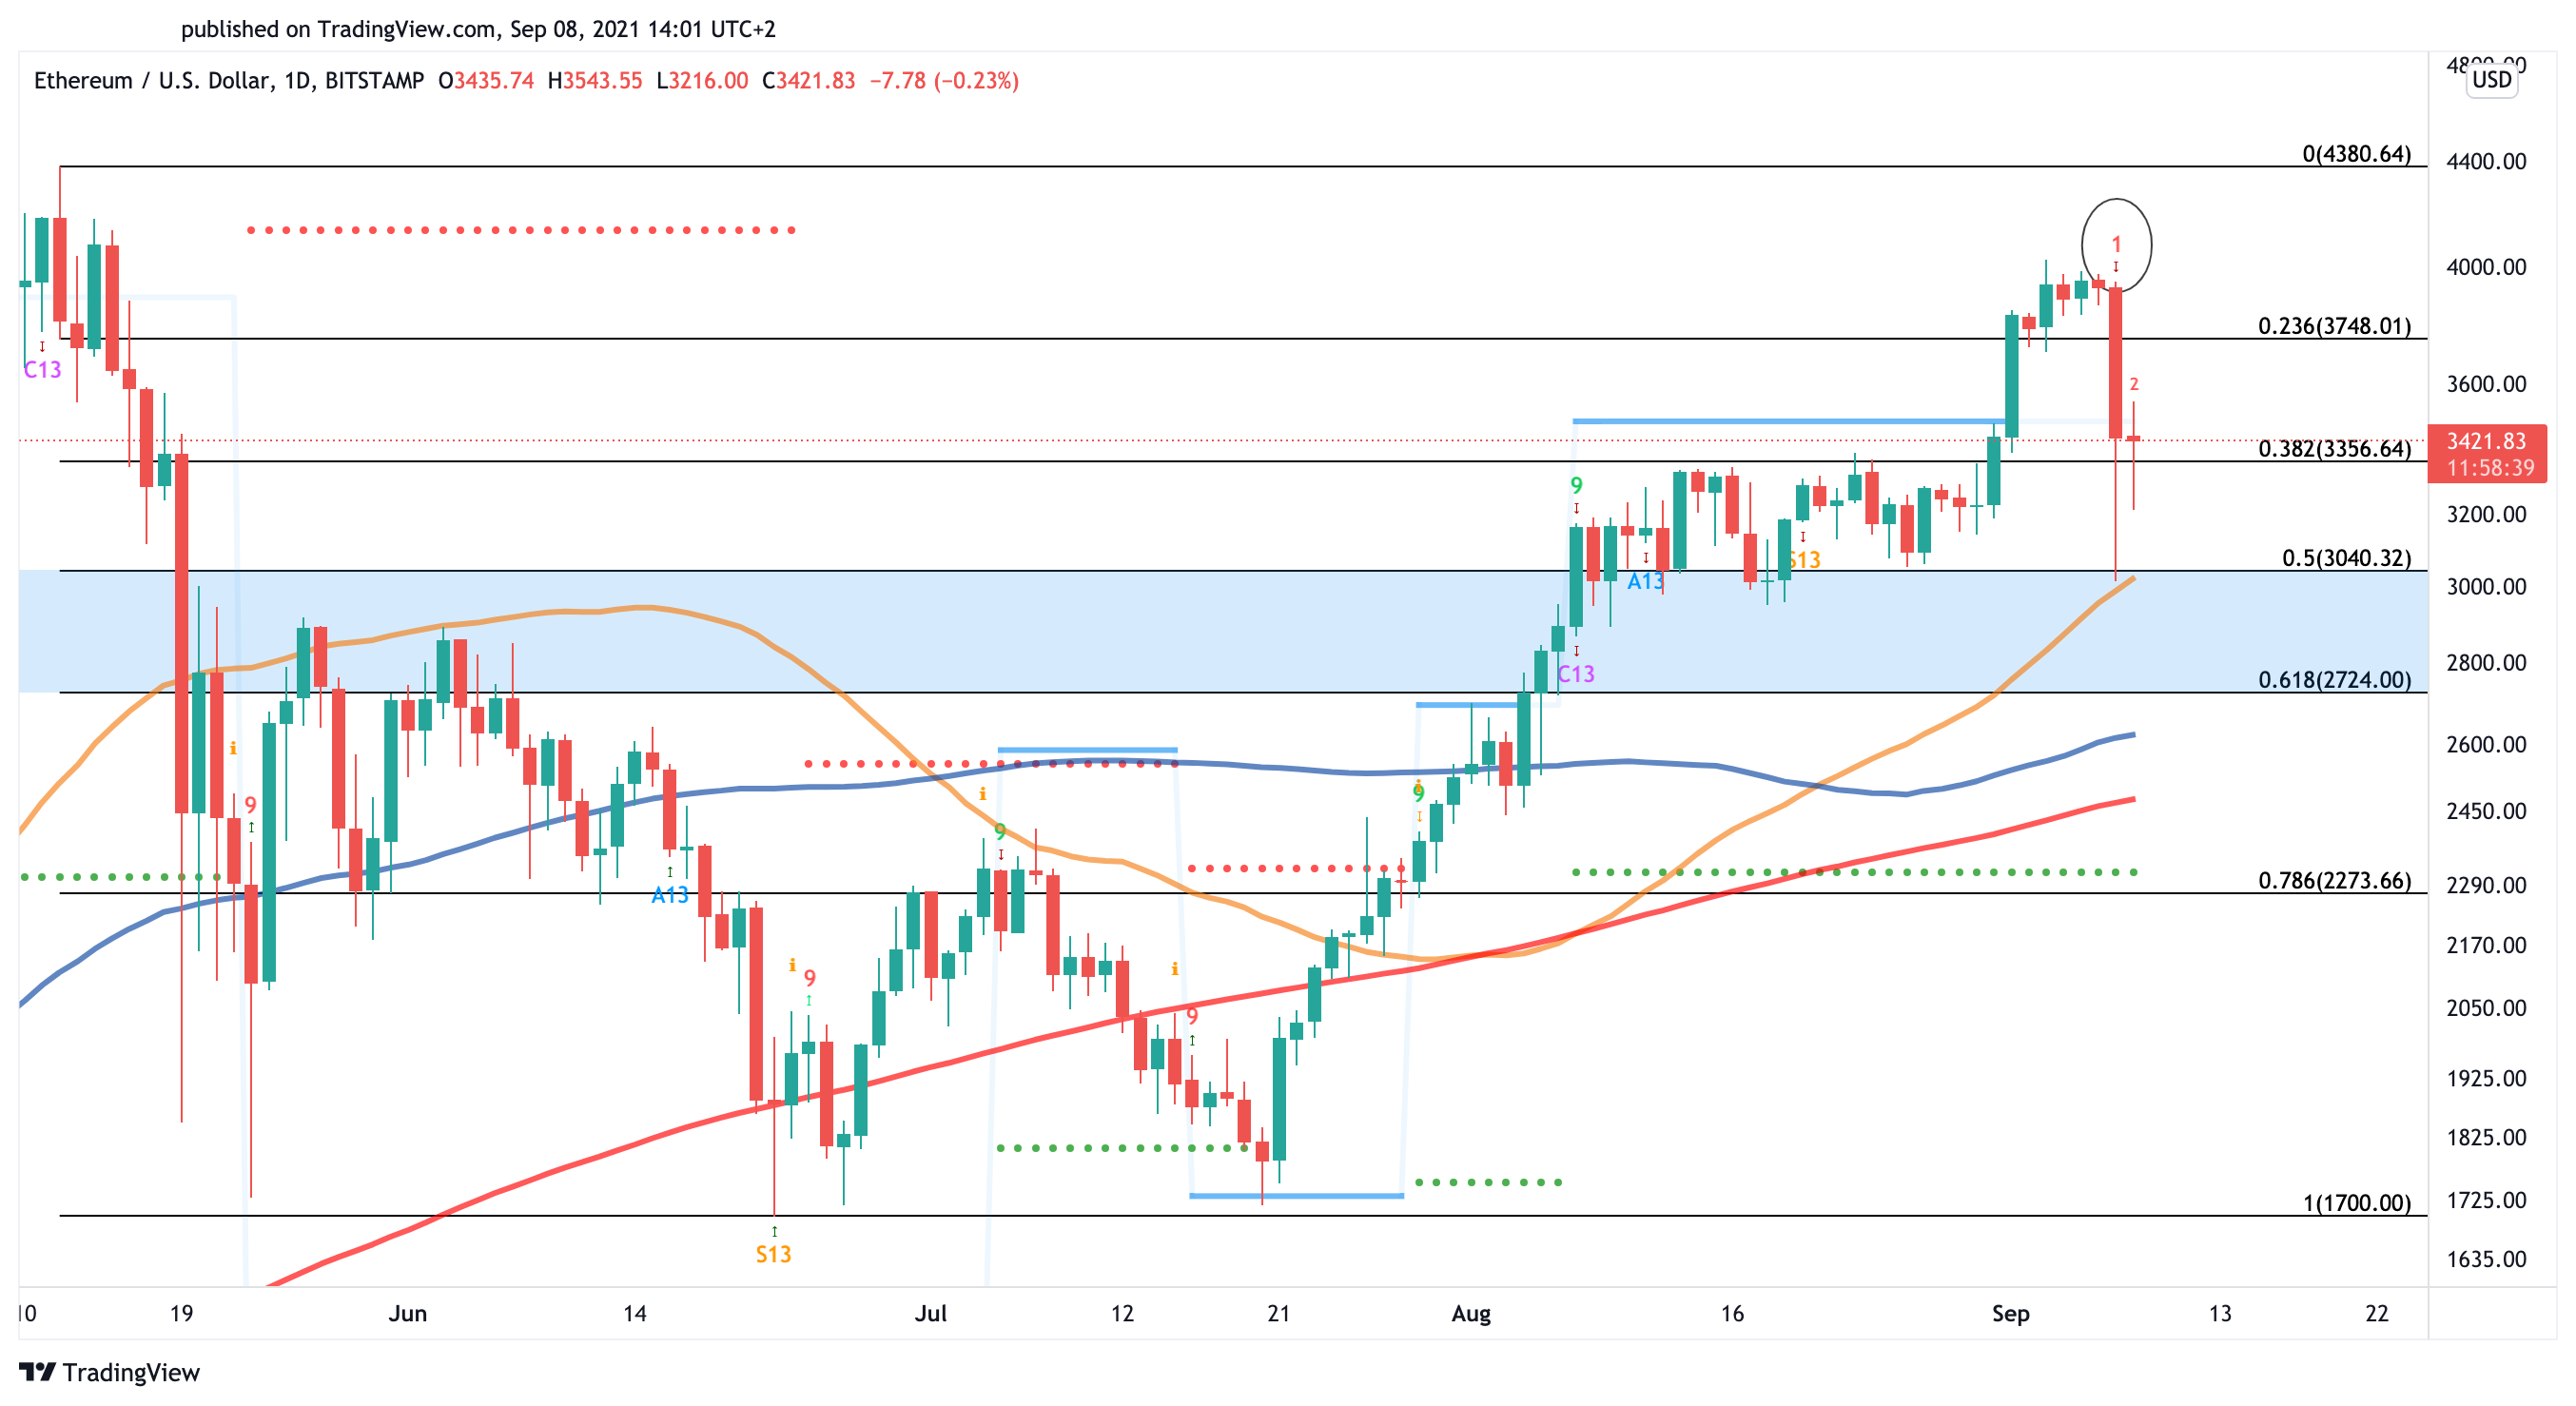
Similar to Bitcoin, Ethereum took a 23.3% nosedive contained by the 50-day moving average at $3,000.
The downward impulse was anticipated by the Tom DeMark (TD) Sequential indicator, which presented a sell signal on the daily chart. The bearish formation is indicative of a one to four daily candlesticks retracement before the uptrend resumes.
ETH may have further room to drop based on the TD setup. Still, the demand wall between $3,000 and $2,700 may have the strength to prevent prices from falling further. Bears would be looking for a decisive daily candlestick close below this support level to target $2,300 or even $1,700.
On the other hand, Ethereum would have to regain $3,750 as support to signal the continuation of the uptrend. At that level, the second-largest cryptocurrency by market cap may be able to attract more buyers for the final push to the mid-May all-time high of $4,380 or a new milestone of $5,000.
Given the uncertainty that the recent sell-off has generated, investors must wait for a sustained close above resistance to avoid further risks. With both Bitcoin and Ethereum on the cusp of mainstream adoption, investors may benefit from having capital ready to deploy in case of a breakout or dip.