Bitcoin Gold / USD Technical Analysis: Not All That Glitters

Share this article
- Bitcoin Gold has fallen to a record trading low after sellers finally broke below the December 2018 low
- BTG / USD is bearish in the short-term with price now trading below a wedge pattern
- Medium-term picture is also bearish with price trapped inside a descending channel pattern
Bitcoin Gold / USD Short-term price analysis
In the short-term, Bitcoin Gold is bearish with the pair hitting an all-time record trading low this month as the broader cryptocurrency market came under selling pressure.
The BTG / USD pair has also broken below a descending wedge pattern; we are currently seeing price moving back towards the breakout area as traders seek further technical confirmation that the break is valid.
Overall, further downside in the BTG / USD pair should be expected as the price is creating bearish lower lows and the cryptocurrency continues to trade below its all-time trading low.
Pattern Watch
The recent break below the descending wedge pattern remains the key theme across the lower time frame charts.
We should also note that price is making lower highs and low lows, which is consistent with the prevailing bearish trend.
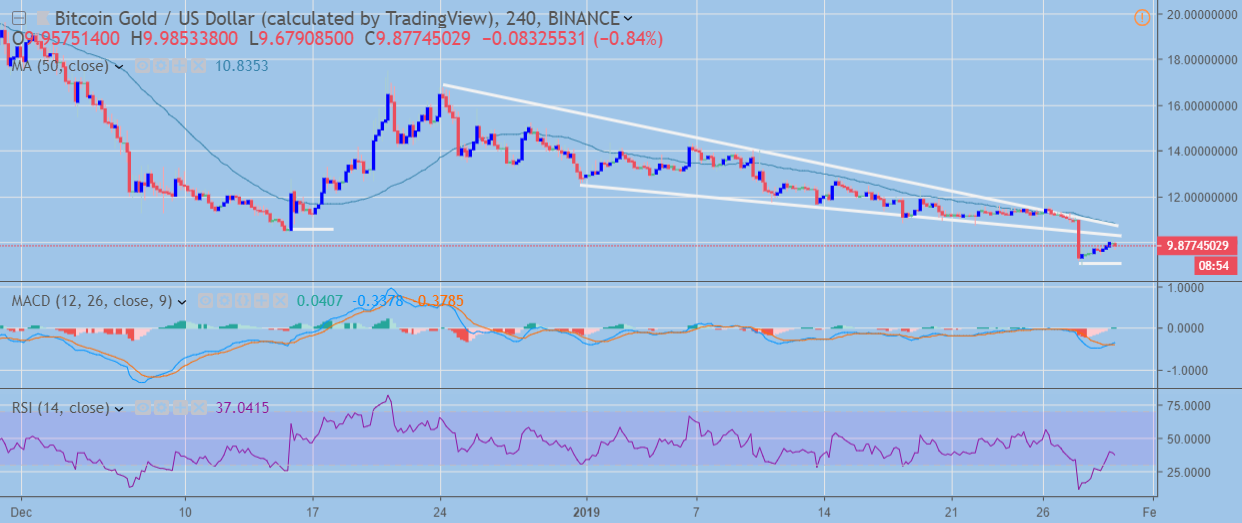
BTG / USD H4 Chart (Source: TradingView)
Relative Strength Index
The RSI indicator is starting to correct from extreme oversold territory on the four-hour time frame. The indicator has remained consistently weak, which is in line with the overall trend.
MACD Indicator
The MACD indicator is correcting higher as traders await the next directional move around the descending wedge pattern’s lower trendline.
BTG / USD Medium-term price analysis
Bitcoin Gold is bearish in the medium-term, with the BTG / USD pairs late December gains now totally eradicated.
Price continues to trade within a descending price channel on the daily time frame, with the trendline support holding firm despite the BTG / USD pair shedding over 15 percent of its value so far this week.
Traders should now wait for a breakout from the descending price channel on the daily time frame, as it will likely signal the next medium-term directional move in Bitcoin Gold.
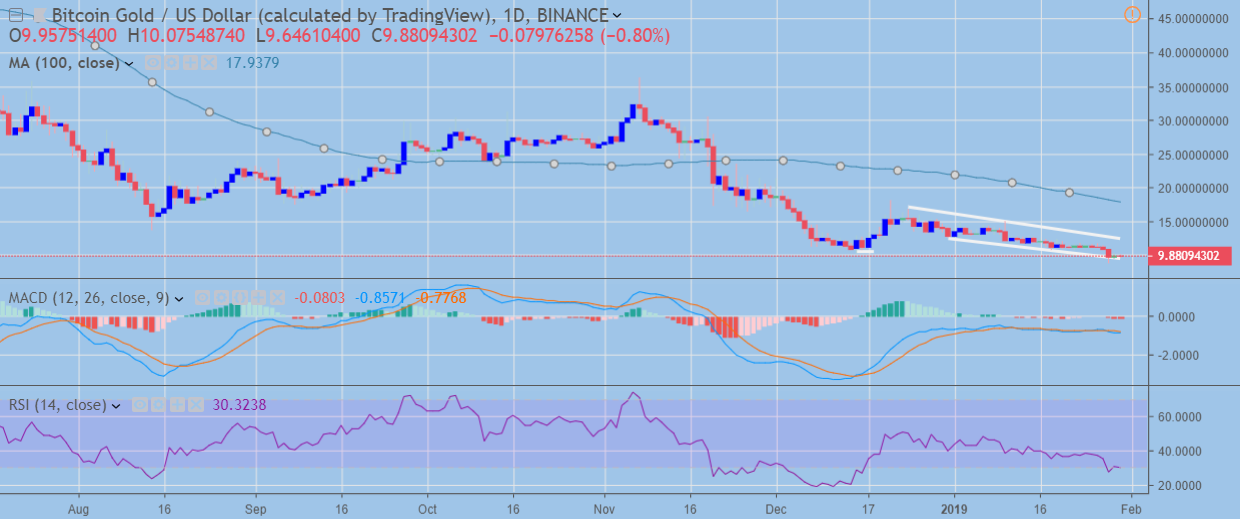
BTG / USD Daily Chart (Source: TradingView)
Pattern Watch
Aside from the descending price channel, traders should watch daily and weekly price closes below the BTG / USD pairs all-time price low.
It is also worth noting that the monthly price for Bitcoin Gold is nearly upon us, monthly price close beneath the pairs former all-time low would be extremely bearish.
RSI + MACD Indicators
The RSI is bearish on the daily time frame and starting to correct from oversold trading conditions, while the daily MACD indicator is starting to turn lower, although a bearish crossover has yet to take place despite the early week decline.
Decentral Media, Inc., the publisher of Crypto Briefing, is not an investment advisor and does not offer or provide investment advice or other financial advice. Nothing on this website constitutes, or should be relied on as, investment advice or financial advice of any kind. Specifically, none of the information on this website constitutes, or should be relied on as, a suggestion, offer, or other solicitation to engage in, or refrain from engaging in, any purchase, sale, or any other any investment-related activity with respect to any transaction. You should never make an investment decision on an investment based solely on the information on our website, and you should never interpret or otherwise rely on any of the information on this website as investment advice. We strongly recommend that you consult a licensed investment advisor or other qualified financial professional if you are seeking investment advice on an investment.
Share this article
