
Bitcoin Price Analysis BTC / USD: Preparing For Takeoff
Multiple bullish patterns and indicators suggest a bright future.
- Bitcoin has a bullish short-term outlook, with the cryptocurrency testing towards the $13,000 resistance level
- The four-hour time frame shows that bulls are close to invalidating a bearish head and shoulders pattern
- The daily time frame shows that the BTC / USD pair is trading above the neckline of a large inverted head and shoulders pattern
Bitcoin / USD Short-term price analysis
Bitcoin has a bullish short-term trading outlook, with the BTC / USD pair testing back towards the best levels of the year so far.
The four-hour time frame is showing that BTC / USD bulls are working hard to invalidate a bearish head and shoulders pattern, following a strong technical bounce from the $9,600 level.
Key upcoming technical resistance is currently located at the $13,335 and $13,900 levels.
Technical indicators on four-hour time frame are bullish and continue to issue a strong buy signal.

Pattern Watch
Traders should note that a bullish inverted head and shoulders pattern will form if the BTC / USD pair reaches the current 2019 trading high.
Relative Strength Index
The Relative Strength indicator on the four-hour time frame is bullish, although it is trading in overbought territory.
MACD Indicator
The MACD indicator on the four-hour time frame is bullish and continues to generate a buy signal.
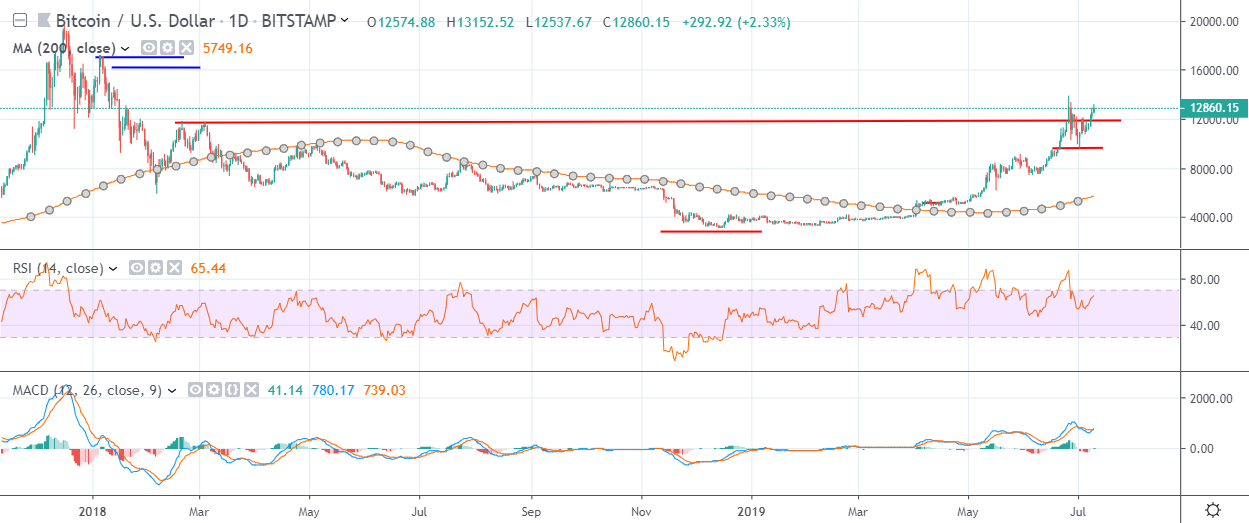
Bitcoin / USD Medium-term price analysis
Bitcoin has an increasingly bullish medium-term trading outlook, with the BTC / USD pair once again trading above breakout technical resistance on the daily time frame.
The daily time frame is showing that the BTC / USD pair has moved back above the neckline of a large inverted head and shoulders pattern, with medium-term bulls attacking towards the current 2019 trading high.
Key technical resistance above the $13,900 level on the daily time frame is currently located at the $16,00 and $17,000 levels.
Technical indicators on the daily time frame are bullish, following a much-needed technical correction lower.
Pattern Watch
Traders should note that the bullish inverted head and shoulders pattern on the daily time frame has an upside projection of around $7,800.
Relative Strength Index
The Relative Strength indicator on the daily time frame has turned bullish and is now starting to issue a buy signal.
MACD Indicator
The MACD indicator on the daily time frame is bullish on the daily time and is currently issuing a buy signal.
Conclusion
Bitcoin faces a crucial test of demand around the $13,000 level, with bulls needing to advance the cryptocurrency well above this area to secure fresh medium-term buying interest.
The four-hour time frame clearly depicts that a new bullish pattern will form if BTC / USD buyers continue to rally price, while technical failure from current levels will complete a bearish head and shoulders pattern.
Bitcoin was the first of our coin guides, and is also our highest-rated deep research project.