 Earn with Nexo
Bitcoin’s Coming Decisive Price Movement
Bitcoin is sitting at a make-or-break point. This coming week BTC will decide whether to continue its bullish trend or pullback.
Bitcoin is sitting at a make-or-break point. This coming week BTC will decide whether to continue its bullish trend or pullback.
A Pivotal Point on Bitcoin’s Trend
Bitcoin entered a bull rally on Jan. 3 that has seen its price rise by nearly 40%. The flagship cryptocurrency went from trading at a low $6,900 to a high of $9,550 on Jan. 30. Since the peak, BTC began a consolidation phase without a clear sign of where it is heading next.
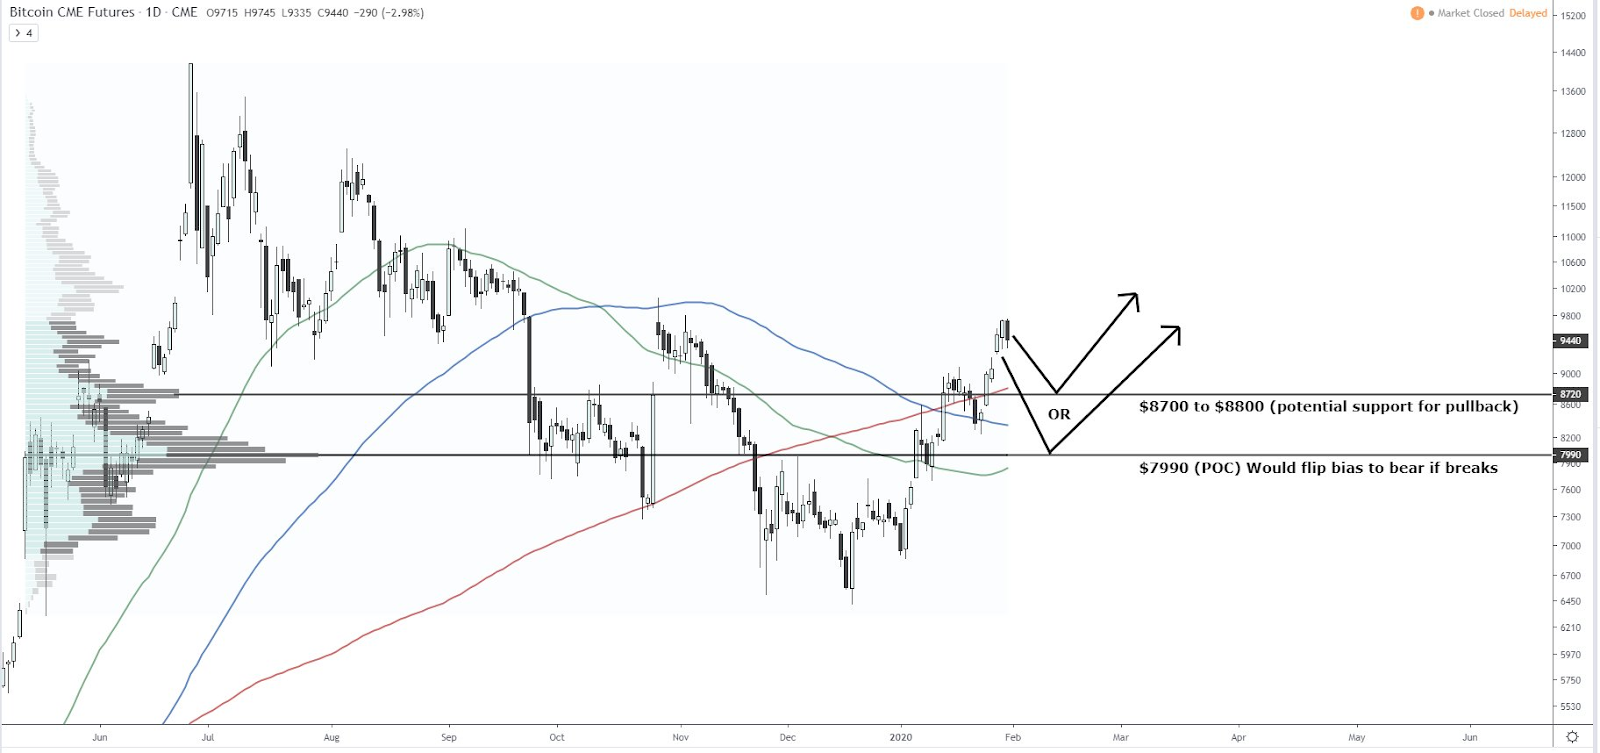
According to Josh Rager, a cryptocurrency trader and the co-founder of Blockroots, the recent price rejection off of the $9,500 resistance level could trigger a steep correction. A spike in the selling pressure behind BTC could push its price down to $8,800 or $8,700 before the bullish trend continues.
Rager believes that a break below this support level could cause panic among investors, sending Bitcoin down to $8,000 or $7,900.
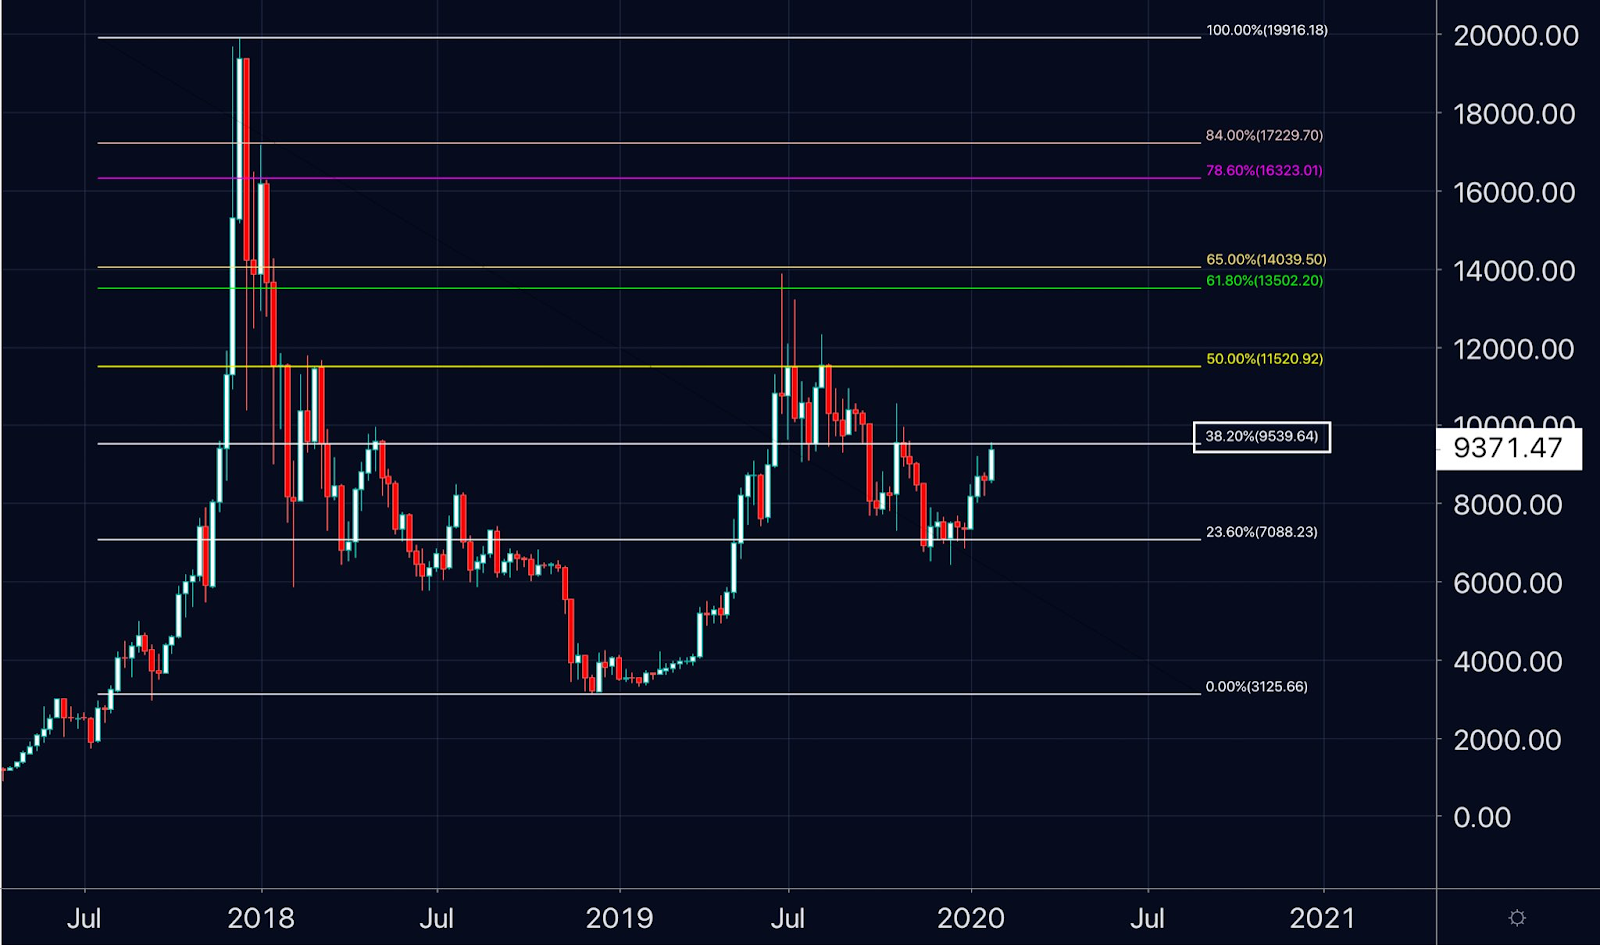
Despite Rager’s assessment of a retracement, Big Chonis, a stock and cryptocurrency trader with over 10 years of experience, argues that “the weekly chart paints a different picture.” Chonis maintains that a weekly close above the $9,500 resistance level would be “very bullish” for Bitcoin.
Breaking this significant price barrier could send investors into a stage of FOMO (fear-of-missing-out). The pioneer cryptocurrency could surge quickly to the next level of resistance given by the 50 percent Fibonacci retracement level, according to Chonis. This resistance level sits at $11,520.
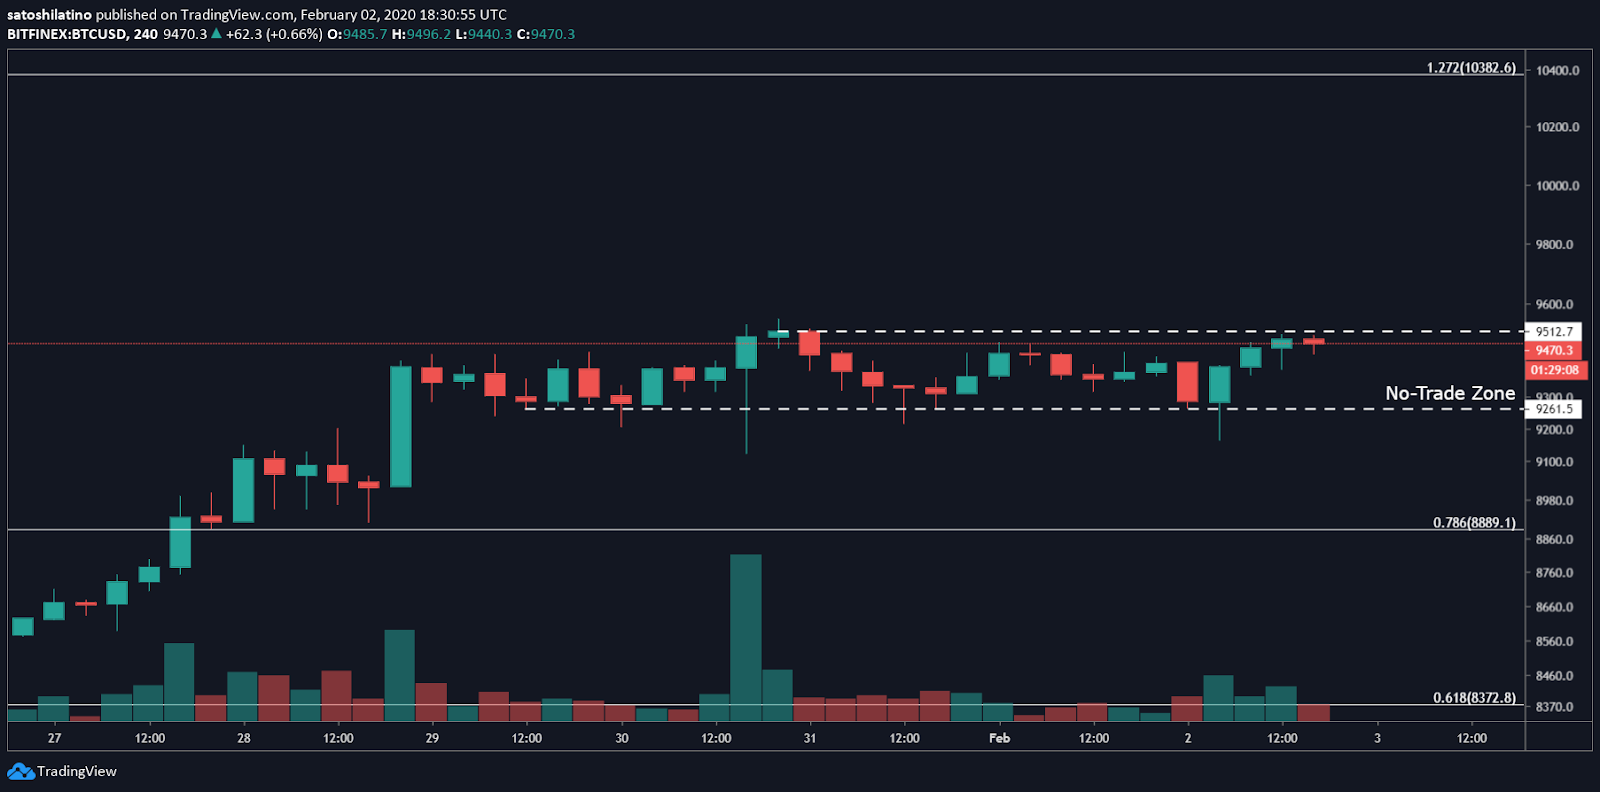
The ambiguity about the fate of Bitcoin can be seen throughout the entire crypto market. As a result, the trading range between $9,260 and $9,500 is a reasonable no-trade zone. Moving below support would likely take BTC to the 78.6% or 61.8% Fibonacci retracement level. Conversely, closing above resistance could allow this crypto to test the 127.2% Fibonacci retracement level at $10,400.
Overall Market Sentiment
Based on the Crypto Fear and Greed Index, investors appear to be overwhelmingly bullish about Bitcoin. In fact, this technical index is sensing high levels of greed among market participants over the past few days. Greed is usually perceived as a negative sign, which indicates that a selling opportunity could present itself soon. As Warren Buffett once said, “be fearful when others are greedy and greedy when others are fearful.”