 Earn with Nexo

BitTorrent Price Analysis BTT / USD: Imminent Collision
BTT is swiftly approaching its critical technical support.
- BitTorrent has a bearish short-term outlook, with the BTT / USD pair continuing to weaken below its 200-period moving average on the four-hour time frame
- The four-hour time frame shows that the BTT / USD pair is continuing to post bearish lower lows and lower highs
- The daily time frame shows that the cryptocurrency remains trapped within a descending price channel
BitTorrent / USD Short-term price analysis
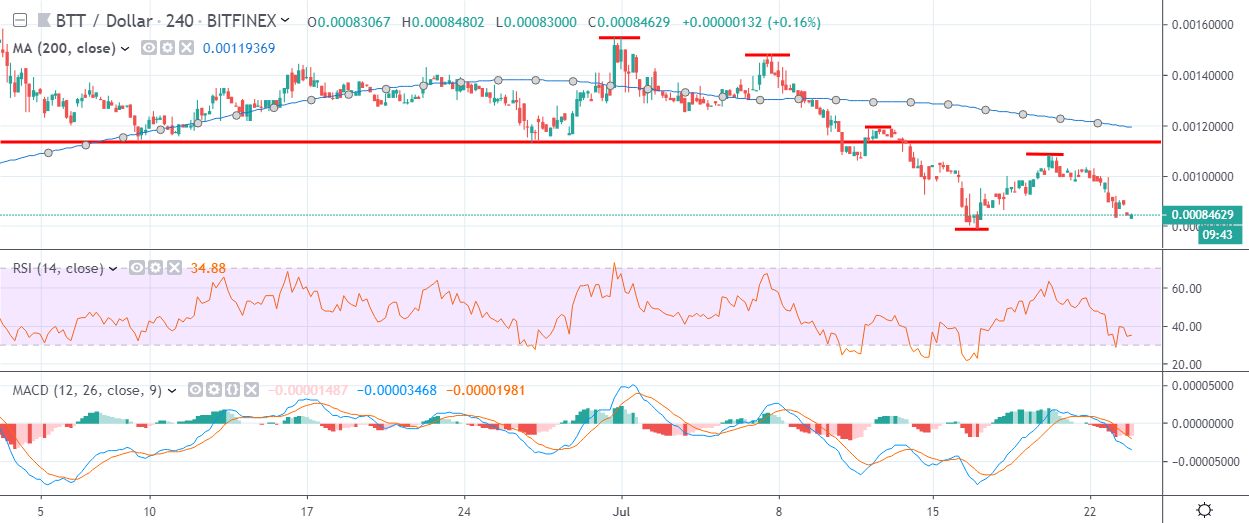
BitTorrent has a bearish short-term trading outlook, with the BTT / USD pair continuing to weaken below its 200-period moving average on the four-hour time frame.
The four-hour time frame shows that sellers are in full control of the BTT / USD pair, with price continuing to create bearish lower lows and lower highs.
Technical indicators on four-hour time frame remain bearish and continue to issue sell signals.
Pattern Watch
Traders should note that a bearish double-top pattern is also in play on the four-hour time frame.
Relative Strength Index
The Relative Strength Index on the four-hour time frame is also bearish and continues to generate a sell signal.
MACD Indicator
The MACD indicator on the four-hour time frame is bearish and continues to generate a sell signal.
BitTorrent / USD Medium-term price analysis
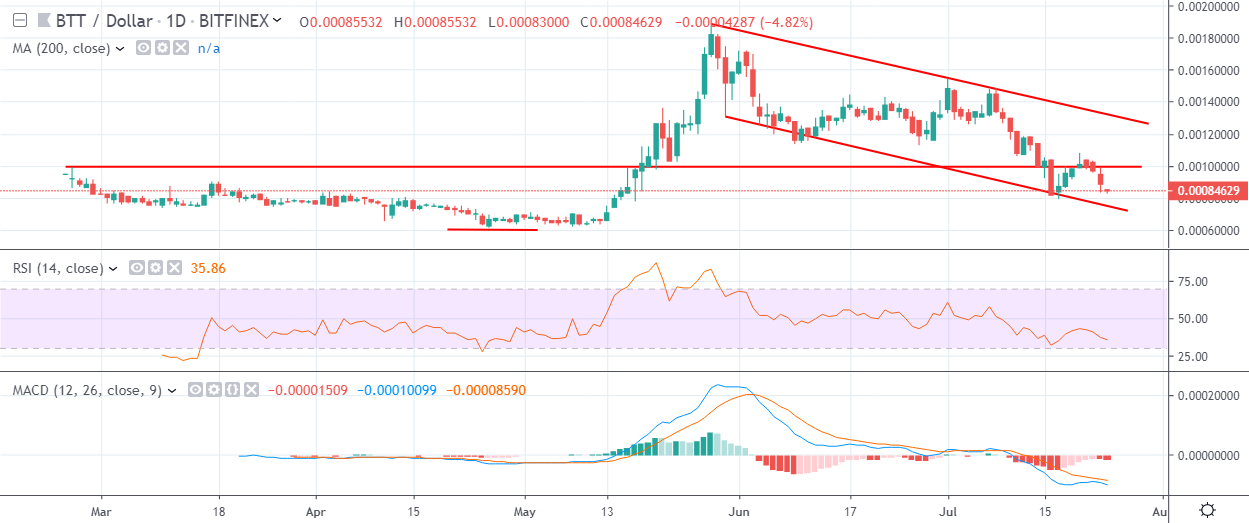
BitTorrent has a bearish medium-term trading bias, with the BTT / USD pair trading back under key technical support on the daily time frame.
The daily time frame is showing that the BTT / USD pair remains trapped within a descending price channel, with the cryptocurrency approaching make or break support.
Technical indicators on the daily time frame are bearish and continue to issue strong sell signals.
Pattern Watch
Traders should note that an upside reversal may soon occur in the BTT / USD pair, as descending price channels are typically considered to be bullish reversal patterns.
Relative Strength Index
The Relative Strength Index on the daily time frame is bearish and shows scope for further downside.
MACD Indicator
The MACD on the daily time frame is bearish, with the MACD signal line and histogram issuing sell signals.
Conclusion
BitTorrent is fast-approaching critical technical support on both time horizons, with BTT / USD bears currently firmly in control of price action.
Traders focus will soon be placed upon the key upcoming trendline support, where the cryptocurrency will either bounce sharply or continue to post bearish lower lows.