BitTorrent Price Analysis BTT / USD: Shelter From The Storm
Recent fundamental news put the pair out of the danger zone.

Share this article
- BitTorrent has a bullish short-term outlook, with the BTT / USD pair recovering back above key support on the four-hour time frame
- The four-hour time frame continues to show a bearish head and shoulders pattern
- The daily time frame shows a bullish breakout from a descending price channel
Fundamental Analysis
BitTorrent reports gains prior to the launch of its testnet today. The project sees itself as the “first major use case of blockchain by introducing the concept of cryptocurrency to 100 million users.” Although, the project does have a large user base, the success of blockchain integration to its platform is still questionable. Nevertheless, the launch will likely attract interest from speculators.
BitTorrent / USD Short-term price analysis
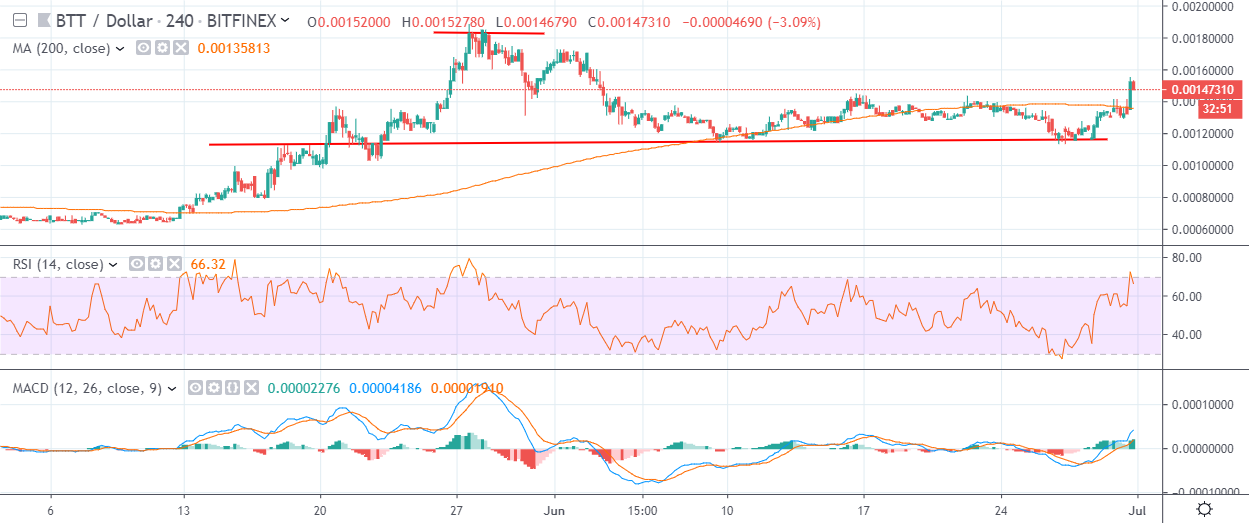
BitTorrent has a bullish short-term trading outlook, with the BTT / USD pair recovering back above key support on the four-hour time frame.
The four-hour time frame continues to show a head and shoulders pattern, with sellers so far unable to move price under the neckline of the bearish pattern.
Technical indicators on four-hour time frame remain bullish and continue to generate a buy signal.
Pattern Watch
Traders should note that a bearish double-top pattern has also formed on the four-hour time frame.
Relative Strength Index
The Relative Strength indicator on the four-hour time frame is bullish, although it is now in overbought territory.
MACD Indicator
The MACD indicator on the four-hour time frame is bullish and continues to generate a buy signal.
BitTorrent / USD Medium-term price analysis
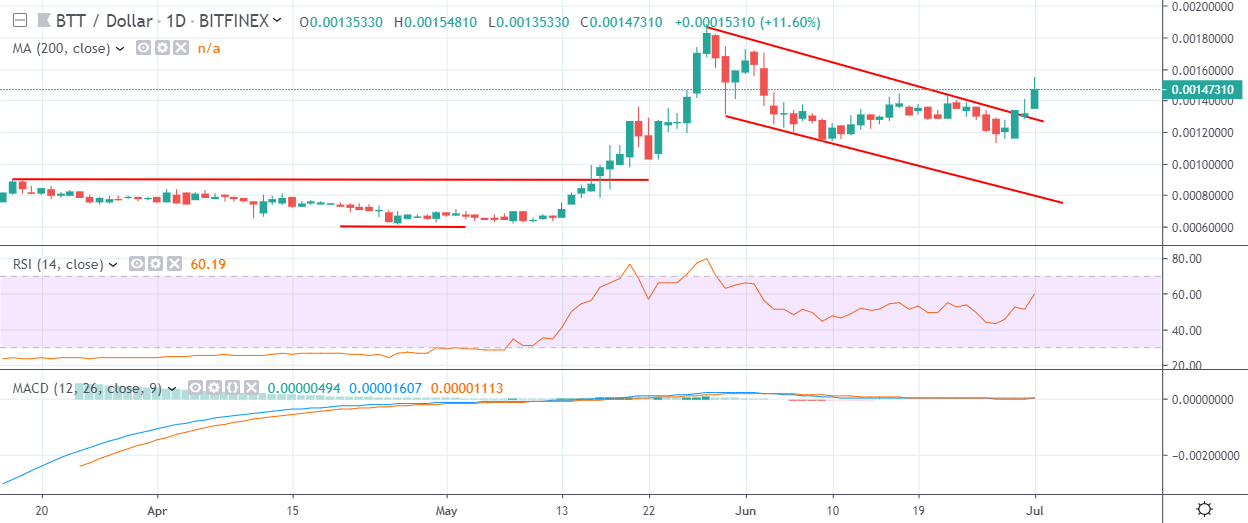
BitTorrent has a bullish medium-term trading bias, with the BTT / USD pair performing a breakout above key trendline resistance.
The daily time frame is also showing that the BTT / USD pair has broken above a descending price channel, with the current 2019 trading high the overall upside target of the bullish breakout.
Technical indicators on the daily time frame are currently mixed and proving conflicting trading signals.
Pattern Watch
Traders should note that descending price channels are typically considered to be bullish patterns.
Relative Strength Index
The Relative Strength indicator on the daily time frame is rising and shows scope for further upside.
MACD Indicator
The MACD indicator on the daily time frame is neutral, with the MACD signal line and histogram both flatlined.
Conclusion
BitTorrent has performed a much-needed move to the upside, moving the cryptocurrency away from an area of danger over the short-term.
The recent breakout on the daily time frame will need to continue in order for bulls to negate the bearish pattern weighing on BTT / USD pair’s in the short-term.
Share this article
