BitTorrent Price Analysis BTT / USD: Smoking Hopium
BitTorrent is bullish and setting new all-time highs, seemingly propelled by hopes and dreams.

Share this article
- BitTorrent has a bullish short-term outlook, with the BTT / USD pair trading at its highest level since February 2019
- The BTT / USD pair now has a strong bullish bias over the medium-term
- The large inverted head and shoulders on the daily time frame has now reached its full upside objection
BitTorrent / USD Short-term price analysis
BitTorrent has a bullish short-term trading outlook, with the BTT / USD pair moving to its all-time high.
The four-hour time frame shows that the recent strong advance in the BTT / USD pair has now invalidated the bearish head and shoulders pattern.
Technical indicators on four-hour time frame remain bullish and continue to generate a buy signal.
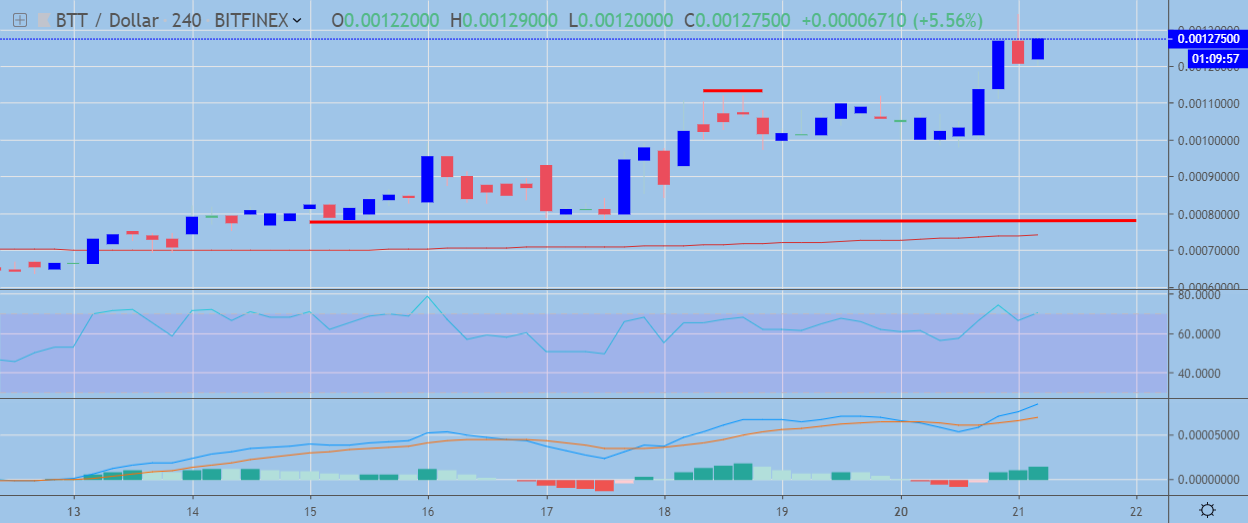 BTT / USD H4 Chart by TradingView
Pattern Watch
Traders should note that the bullish breakout on the four-hour time frame has yet to reach its full upside target.
Relative Strength Index
The Relative Strength Index indicator on the four-hour time frame is bullish, although it has now reached extreme overbought conditions.
MACD Indicator
The MACD indicator on the four-hour time frame is bullish and continues to generate a strong buy signal.
Fundamental Analysis
BitTorrent gained its momentum after Justin Sun has “announced” that the coin will be in top-30 on Coinmarketcap during Q2. Moreover, Sun has also tweeted today that they have “more epic plans for BTT,” which also seems to have positively affected BTT price.
BitTorrent / USD Medium-term price analysis
BitTorrent has a strong bullish bias over the medium-term, with the BTT / USD pair performing a major technical breakout on the daily time frame.
The daily time frame shows that a large inverted head and shoulders pattern has been triggered, with the bullish pattern reaching its full upside projection.
Technical indicators on the daily time frame are bullish, although they are extremely overbought.
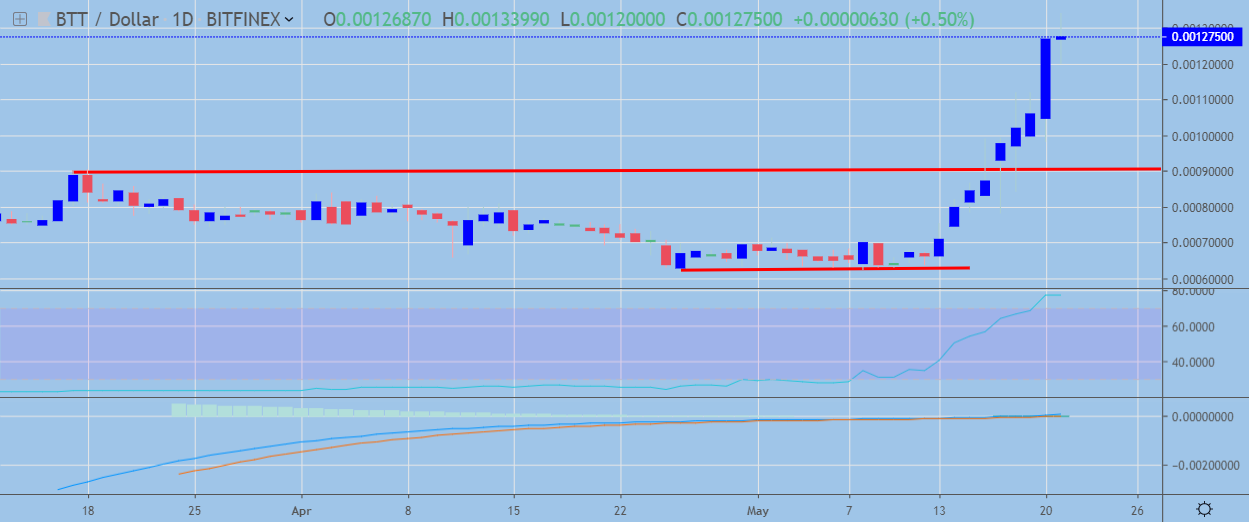 BTT / USD Daily Chart by TradingView
Pattern Watch
Traders should note that the bullish inverted head and shoulders pattern on the daily time frame has extended past its projected upside target.
Relative Strength Index
The Relative Strength Index is bullish, although it is now extremely overbought.
MACD Indicator
The MACD indicator on the daily time frame remains bullish and is pointing to further gains ahead.
Fundamental Analysis
The project’s medium-term prospects depend on the ability of its team to deliver on the promises they have made. BTT still needs to prove to the market that its business model is viable, otherwise, the investors’ interest could quickly fade away, which would negate much of its current value.
Conclusion
BitTorrent Token surged sharply after recently performing a major bullish breakout on the daily time frame. The four-hour time frame is still signaling further upside for the BTT / USD pair, although technical indicators on both time horizons may soon need to correct lower.
Share this article
