
BTC / USD Price Analysis: All Clear
The pair has successfully overcome the $5200 resistance, and is now looking into the $6000 range.
- Bitcoin has a bullish short-term outlook, with the BTC / USD pair moving to a fresh 2019 trading high
- Bulls have now invalidated a bearish head and shoulders pattern on the four-hour time frame
- The daily time frame shows that the BTC / USD pair could test towards the $6,500 level
BTC / USD Short-term price analysis
Bitcoin has a bullish short-term trading bias, with buyers regaining control of the BTC / USD pair and moving the number one cryptocurrency to a new 2019 trading high.
The four-hour time frame is showing that the inverted head and shoulders pattern has reached its overall target, while the bearish head and shoulders pattern on the mentioned time frame has now been invalidated.
Technical indicators on four-hour time frame have now turned bullish and show that more short-term gains appear likely.
 BTC / USD H4 Chart by TradingView
Pattern Watch
Traders should note that the $5,700 level is now the strongest form of near-term technical resistance.
Relative Strength Index
The Relative Strength Index indicator on the mentioned time frame is bullish and highlights the growing short-term bullish pressure.
MACD Indicator
The MACD indicator on the four-hour time frame has turned bullish, with the MACD signal line and MACD histogram issuing a strong buy signal.
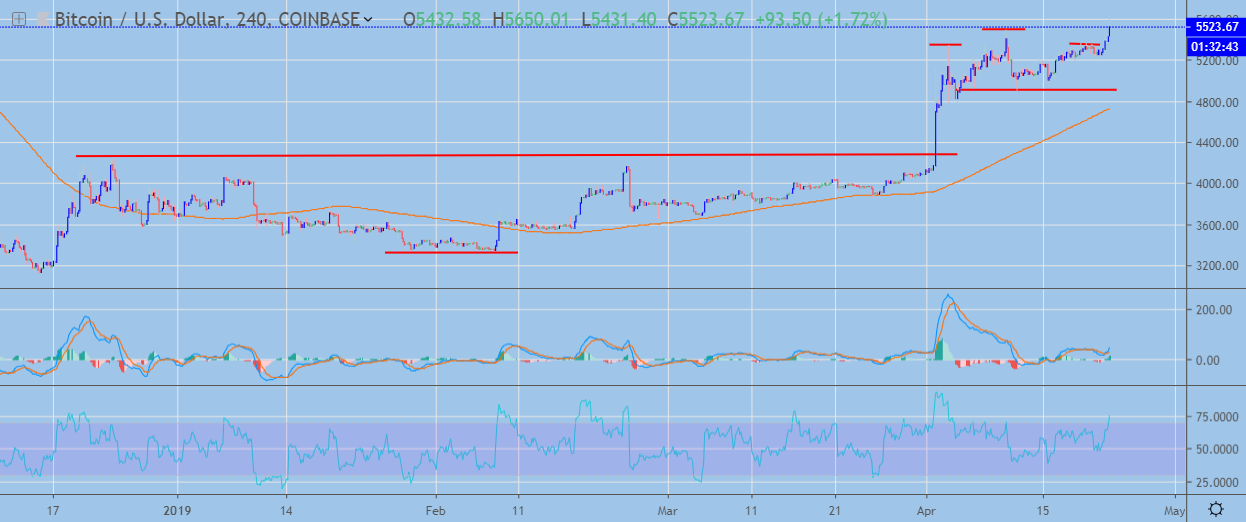
Bitcoin / USD Medium-term price analysis
Bitcoin has a bullish medium-term trading bias, with the BTC / USD pair continuing to gather upside momentum above its 200-day moving average.
The daily time frame shows that the bullish breakout from the falling wedge pattern is steadily gathering pace, with the November 8th, 2018 swing-high, at $6,500, now the strongest area of technical resistance above the $5,700 level.
Technical indicators on the daily time frame remain bullish, although they are trading close to overbought levels.
 BTC / USD Daily Chart by TradingView
Pattern Watch
Traders should note that the overall upside objective of the falling wedge pattern on the daily time frame is located close to the $10,000 level.
Relative Strength Index
The Relative Strength Index on the daily time frame is bullish, although it is once again approaching overbought conditions.
MACD Indicator
The MACD indicator on the daily time frame is bullish, although the MACD signal line is trading in overbought territory.
Conclusion
The number one cryptocurrency has made an impressive upside move after performing a series of bullish daily price closes above the important $5,200 level.
Short-term bulls now face strong technical resistance from the $5,700 level, while the daily time frame is highlighting the $6,500 level as the strongest area of medium-term resistance.
For a quick intro into Bitcoin, check out our coin guide.