Bitcoin Gold Price Analysis BTG / USD: Oncoming Debasement
Bitcoin Gold is surprisingly bullish over the medium-term, though technical indicators clearly suggest an incoming correction.

Share this article
- Bitcoin Gold has a bullish short-term bias, with the BTG / USD pair trading above the 200-period moving average
- The BTG / USD pair is bullish over the medium-term and continues to trade well above its 200-day moving average
- Technical indicators are becoming overstretched, showing room to trade lower
Bitcoin Gold / USD Short-term price analysis
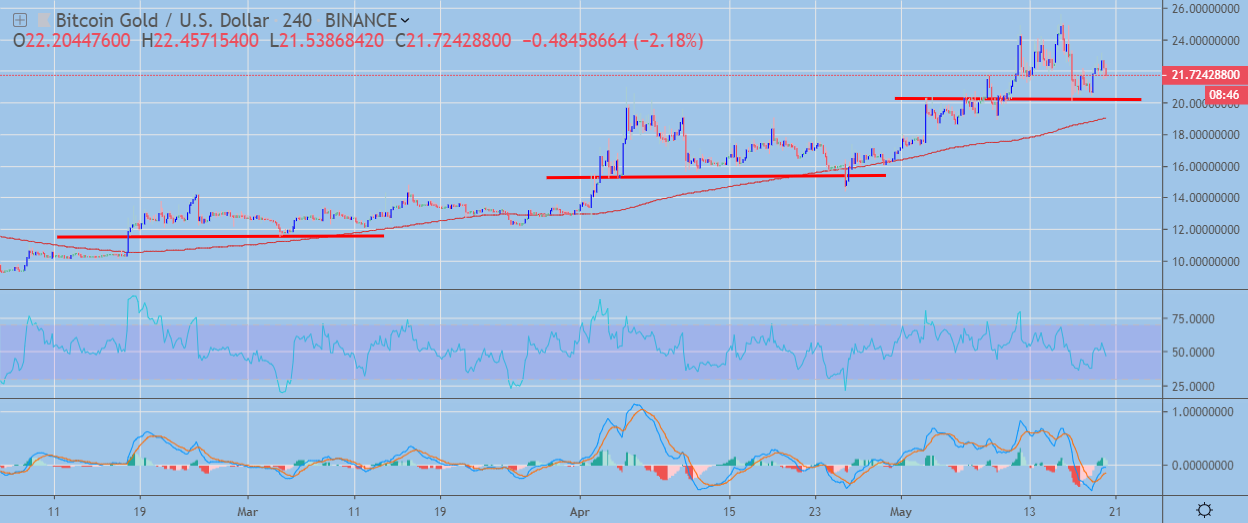
Bitcoin Gold is bullish in the short-term, after creating bullish higher highs on the four-hour time frame.
The four-hour time frame also shows that a bearish head and shoulders pattern has formed, following a strong technical correction from the best trading levels of 2019 so far.
Technical indicators on the four-hour chart have turned bearish and continue to move lower.
 BTG / USD H4 Chart by TradingView
Pattern Watch
Traders should note that bulls have been consistently invalidating any bearish patterns that have formed on the four-hour time frame.
Relative Strength Index
The RSI indicator is still bearish on the four-hour time frame and is struggling to move into positive territory.
MACD Indicator
The MACD indicator is still bearish on the four-hour time frame, although it is failing to generate a clear trading signal.
Bitcoin Gold / USD Medium-term price analysis
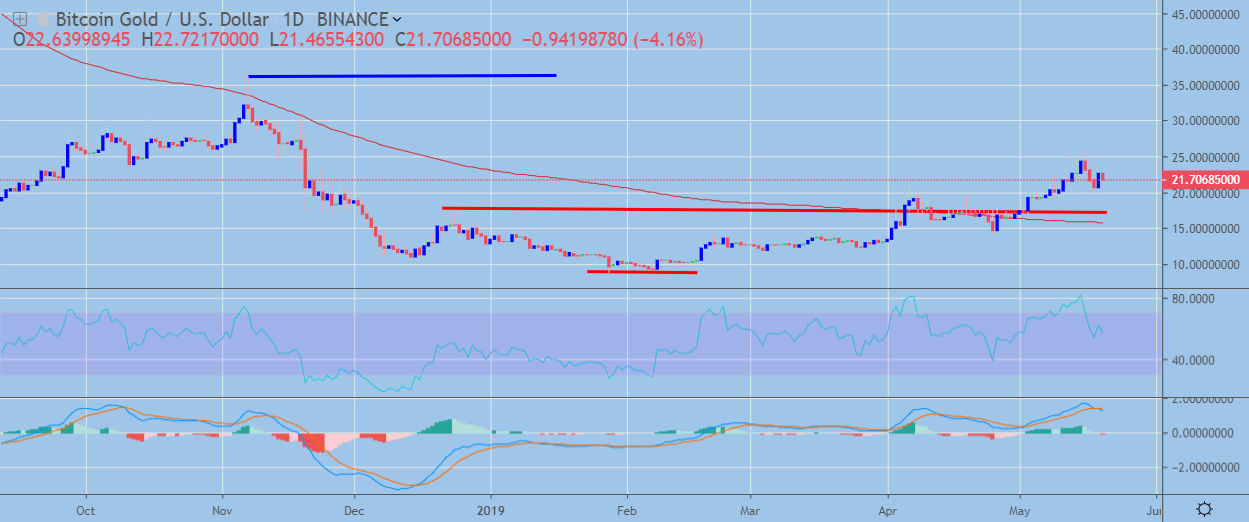
Bitcoin Gold is bullish in the medium-term, with the BTG/USD pair trading well above its 200-day moving average.
The daily time frame is showing that an inverted head and shoulders pattern has been triggered, with the bullish pattern now reaching its full upside projection.
Technical indicators appear overstretched on the daily time frame and have scope to correct significantly lower.
 BTG / USD Daily Chart by TradingView
Pattern Watch
Traders should note that Bitcoin Gold buyers now need to rally the cryptocurrency towards the November 2018 trading high to form an even larger bullish pattern.
Relative Strength Index
The RSI indicator is starting to correct lower, although it has yet to turn bearish.
MACD Indicator
The MACD indicator is bullish on the daily time frame, although it is starting to appear overstretched.
Conclusion
Bitcoin Gold is turning lower in the near-term, with technical indicators across both time horizons pointing to an oncoming technical correction.
BTG / USD bulls will have to rally the cryptocurrency substantially higher over the medium-term in order to form an even larger bullish pattern on the daily time frame.
We’ve covered Bitcoin Gold together with its cousin Bitcoin Diamond in our coin guide.
Share this article
